
Financial distress, county by county.
3,144 U.S. counties scored through the County Distress Index.
How stressed is your county?
1,258 counties are in the two most distressed fifths. See all rankings →
County Stories
All 3,144 counties →
"The Line"
Petersburg City scores 92.8 on the County Distress Index — 2nd most distressed county in the U.S., 1st in Virginia. 45% debt in collections, a Default & Legal domain ranked 3rd in the nation. The 47-point gap with neighboring Chesterfield reveals what Virginia's independent city structure concentrates.
"The Note"
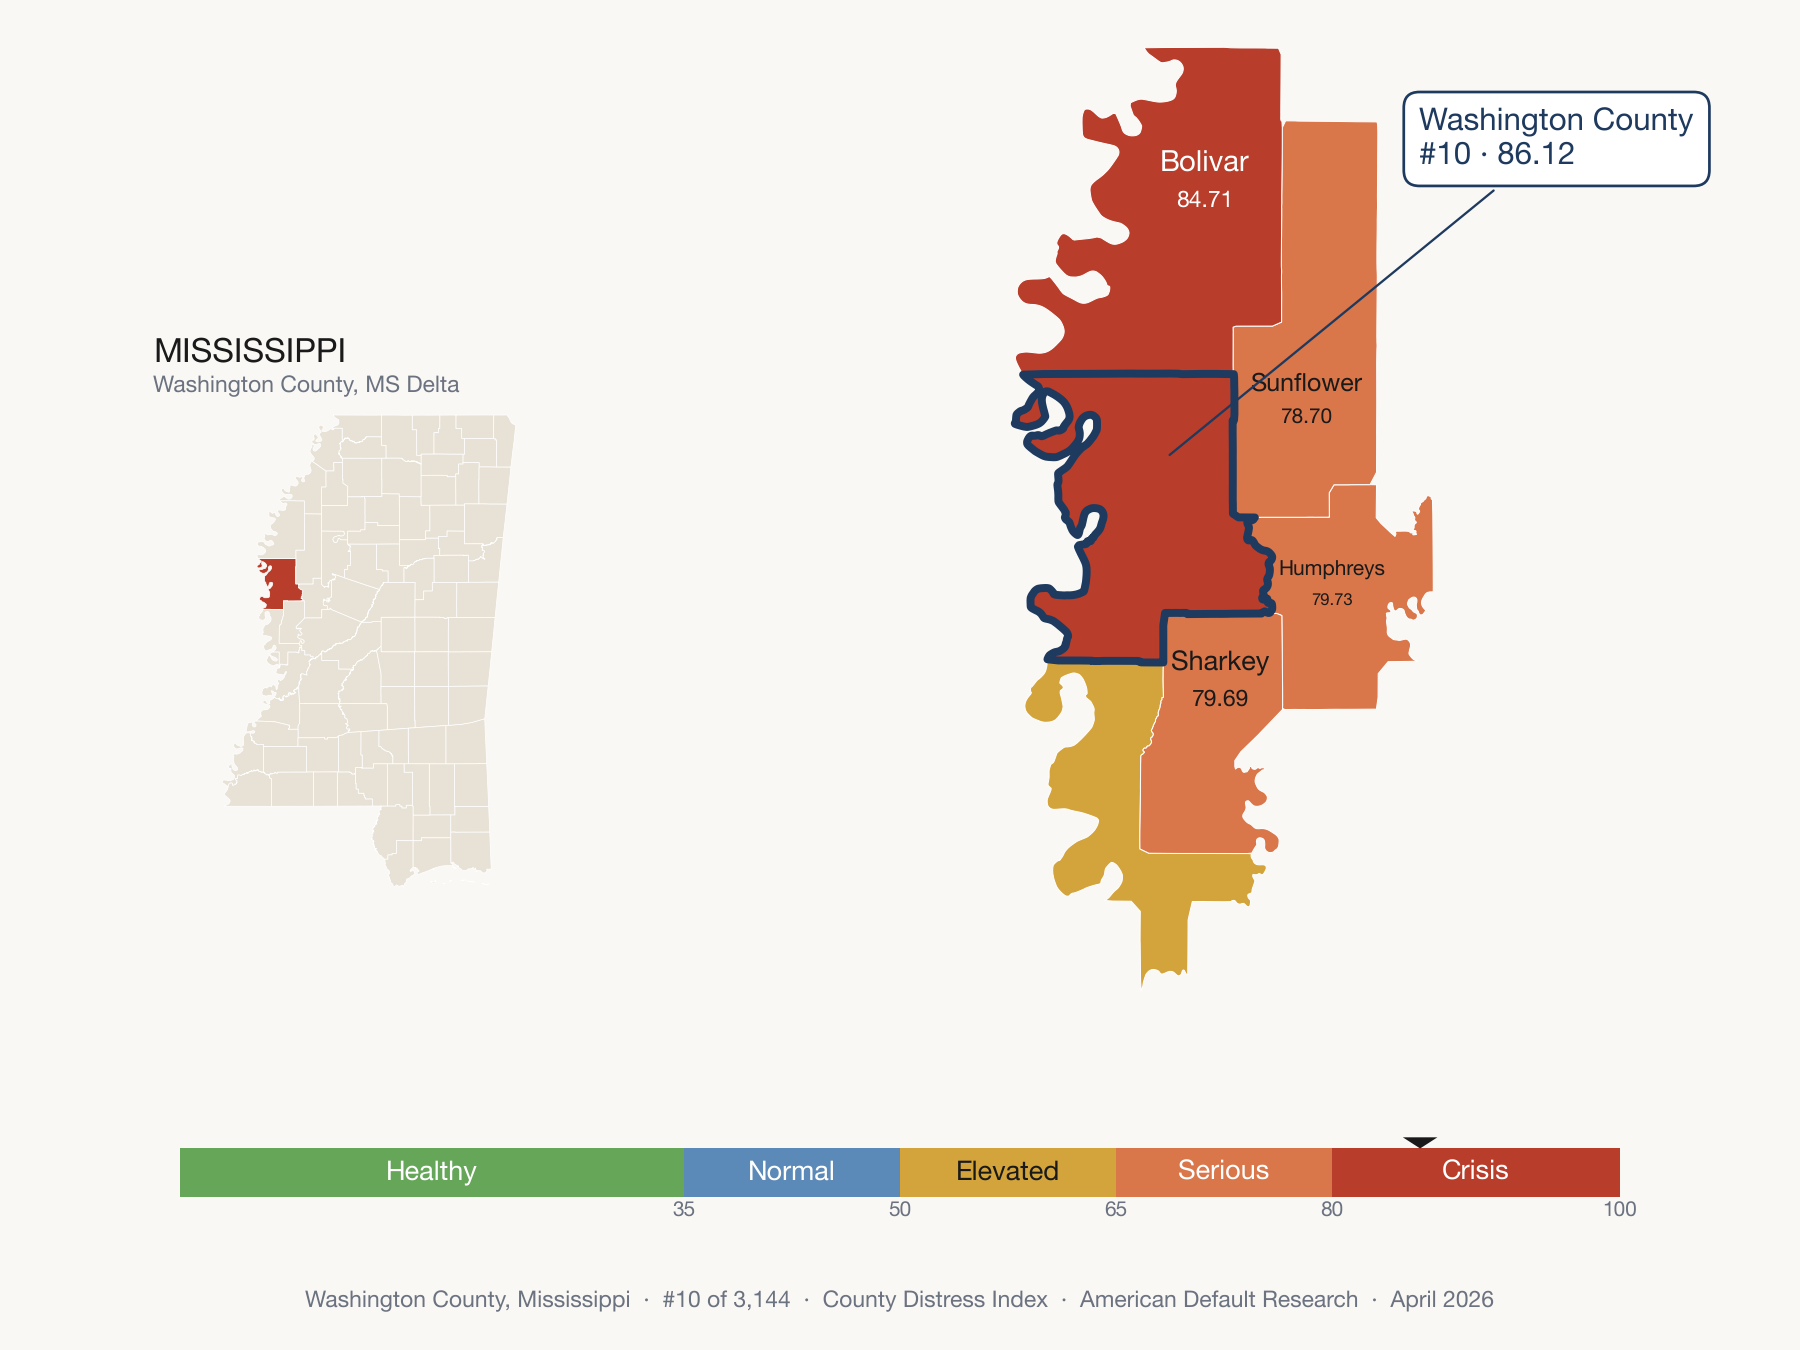
Washington County, MS scores 92.0 on the County Distress Index — 5th of 3,144 U.S. counties, 3rd in Mississippi. 20% auto loan delinquency at the 99th percentile nationally, the Delinquency domain ranked 3rd in the nation. 36% poverty rate. The county seat, Greenville, was home to Pulitzer-winning editor Hodding Carter II, Civil War historian Shelby Foote, and novelist Walker Percy. Today nearly half its children live in poverty.

"The Drainage"
Pemiscot County lands in the most distressed fifth of U.S. counties. Twelfth most distressed in America, first in Missouri. 46% of residents have debt in collections.

"The Room"
Tunica County, MS sits in the most distressed fifth of U.S. counties — 10th of 3,144, 5th in Mississippi. Four casino closures since 2014 have left the county carrying the debt, with its Delinquency, Debt Burden, and Default & Legal domains all pressed against the ceiling.

"The Passage"
Dougherty County, Georgia ranks 14th of 3,144 on the County Distress Index, 2nd in Georgia, with three credit indicators at the 99th percentile.

"The Shade"
Gadsden County lands in the most distressed fifth of U.S. counties — 15th most distressed in America, 1st in Florida. Only majority-Black county in the state. 41% of residents carry debt in collections.

"The Merger"
Bibb County (Macon-Bibb), GA sits in the most distressed fifth of U.S. counties — 32nd of 3,144, 3rd in Georgia. Renter cost burden at the 98th percentile and debt in collections at the 99th despite a 2014 city-county merger.

"The Green"
Richmond County, GA sits in the most distressed fifth of U.S. counties — 4th of 159 in Georgia. Debt in collections at the 98th percentile, auto loan delinquency at the 98th. Home to Fort Eisenhower and Augusta National, one county line from $95,592 median income.

"The Record"
Harlan County, KY sits in the most distressed fifth of U.S. counties — 57th of 3,144, 7th in Kentucky. The most documented poor county in America. 27.3% disability rate at the 98th percentile, poverty and transfer-income at the 98th and 99th. See the full five-domain breakdown.

"The Gin"
Dunklin County, MO scores 82.26 — the most distressed fifth, 91st of 3,144 U.S. counties, 3rd in Missouri. A legacy cotton and soybean economy in the Missouri Bootheel.

"The Rebuilding County"
Wayne County, MO sits in the most distressed fifth of U.S. counties — 100th of 3,144, 4th in Missouri. Its Safety Net & Buffer domain ranks 58th in the nation, with disability, transfer-income, and income all at the 95th percentile. 29.1% disability rate, 22.4% poverty, every domain distressed at once.

"The Yield"
Mitchell County, GA sits in the most distressed fifth of U.S. counties — 106th of 3,144, 11th in Georgia. Top peanut producer with $370M in farm output and 3.6% unemployment, yet its Default & Legal domain ranks 12th in the nation. Full employment, crisis-level debt.
"The Filing"
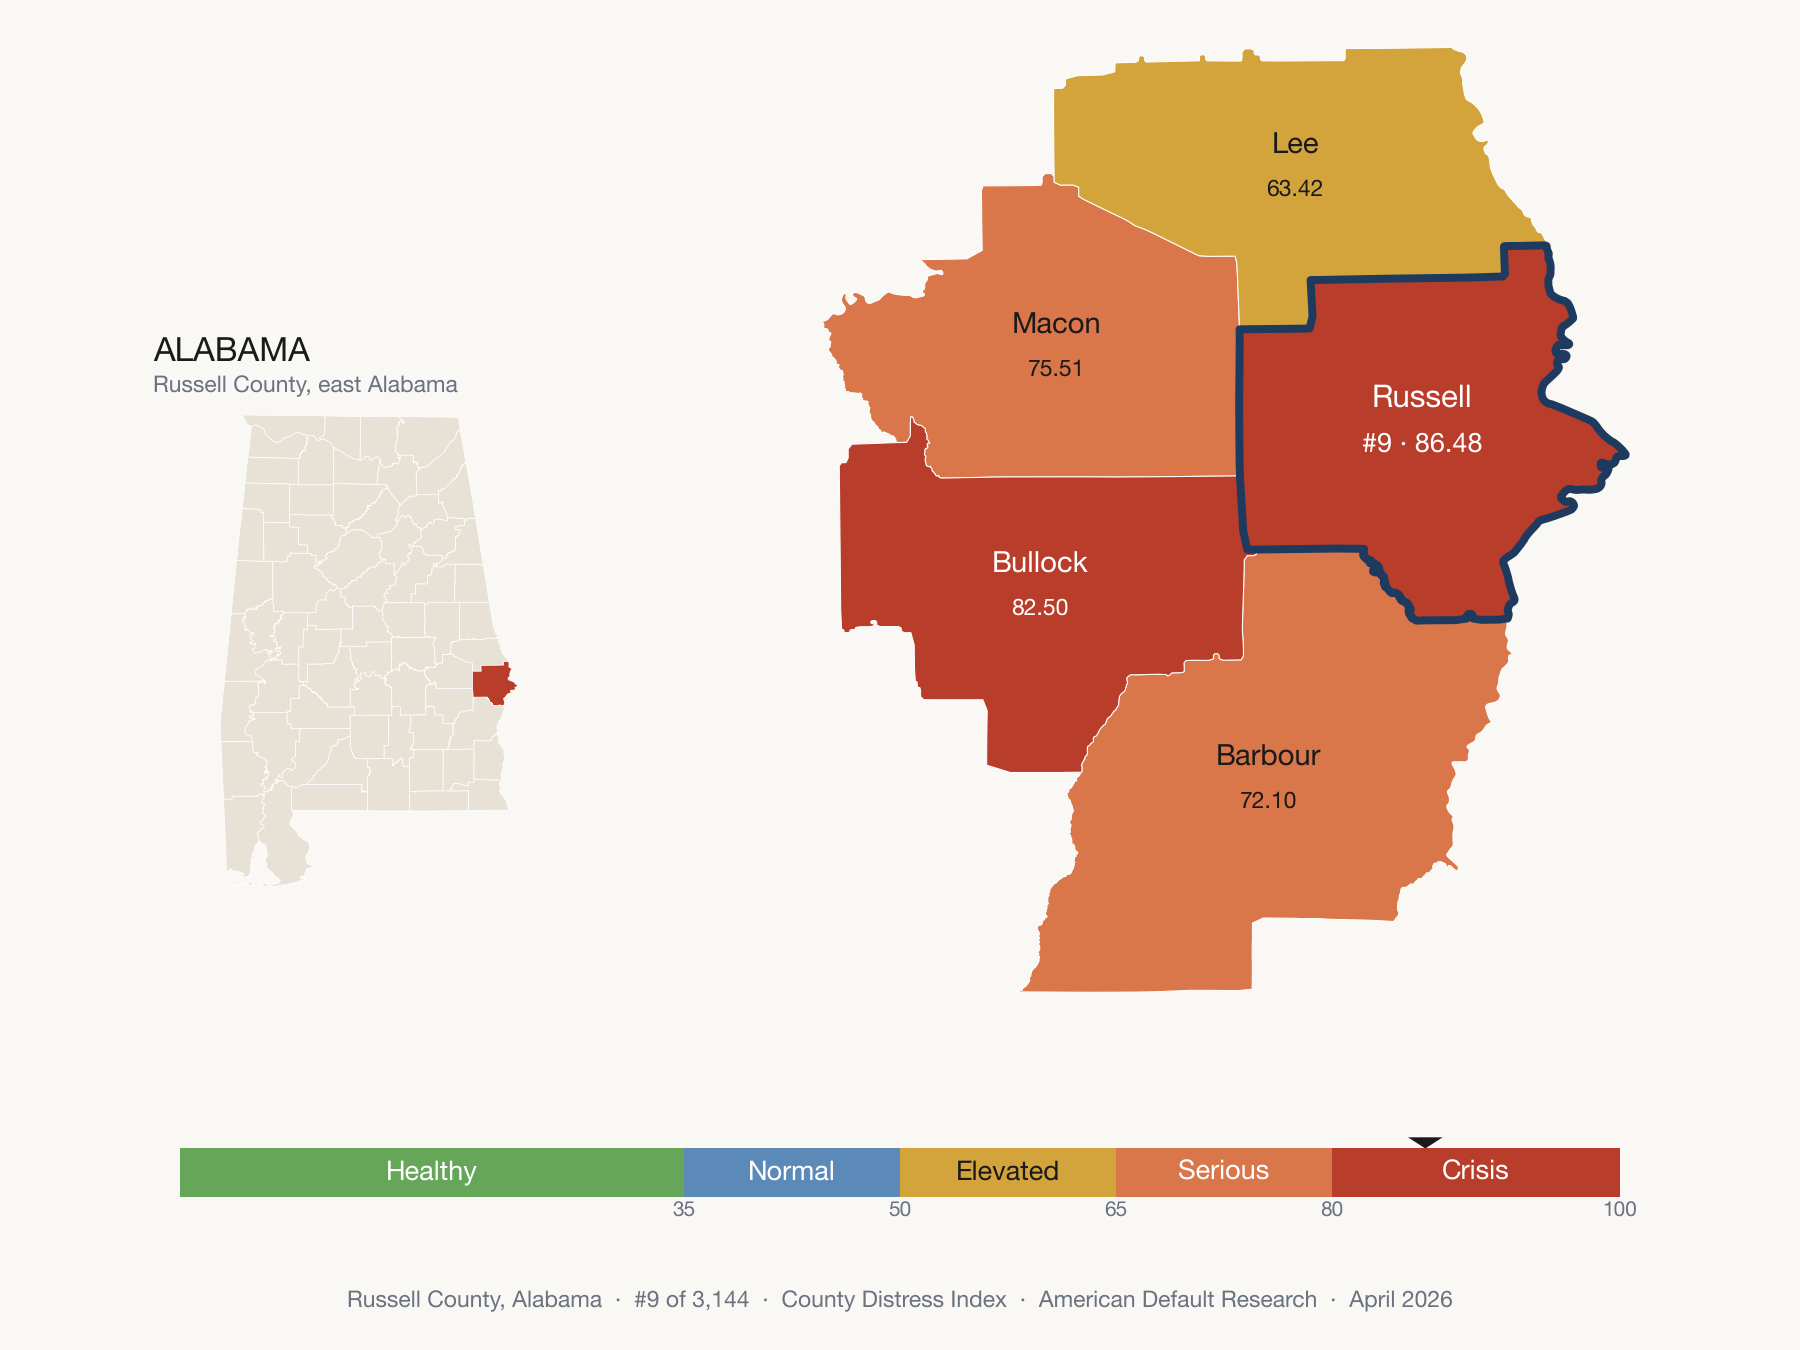
Russell County, AL sits in the most distressed fifth of U.S. counties — 204th of 3,144, 9th in Alabama — and its Default & Legal domain ranks 4th in the nation. 484 bankruptcy filings per 100,000 residents, roughly four times the national median. 45% of residents with a credit file carry debt in collections. Phenix City sits across the Chattahoochee River from Columbus, Georgia, where most of the county's working population commutes.

"The Extraction County"
Glades County, Florida sits in the most distressed fifth on the County Distress Index — more distressed than 90% of U.S. counties, 314th of 3,144. The largest employer is a detention center. There is no hospital. See the full five-domain breakdown.

"The Patron"
Duval County, TX lands in the most distressed fifth of U.S. counties — 360th of 3,144, 30th in Texas. The county that changed American history with 87 votes. 45.8% of income from transfers, a Safety Net & Buffer domain ranked 3rd in the nation. See the full five-domain breakdown.

"The Runway"
Lenoir County lands in the most distressed fifth of U.S. counties — 22nd most distressed in North Carolina. A Navy aviation facility and 3.5% unemployment exist five miles from the state’s most distressed census tract.

"The Irrigation"
Yakima County scores 68.2 on the County Distress Index. Most distressed in Washington. Its Labor domain leads at 96.33 while the safety net holds debt near zero.

"The Bypass"
Quay County, New Mexico lands in the second-most distressed fifth of U.S. counties — more distressed than 74% of them, 16th in New Mexico. A town named for waiting, still waiting. See the full five-domain breakdown.

"The Seat"
DC lands in the second-most distressed fifth of U.S. counties and leads the nation in FHA serious delinquency at 8.34%. Its Debt Burden domain at 76.42 sits 16 points above the composite. See the full five-domain breakdown.

"The Residual"
Lincoln County, Montana scores 55.57 on the County Distress Index — the middle fifth, 7th in Montana — masking a Labor domain at 95.83 and a Safety Net & Buffer domain at 75.34 against a Delinquency domain near the floor at 10.67. A vermiculite mine left a multi-decade asbestos health legacy; the clinic that tracked cases has closed.

"The Arithmetic"
Des Moines County, Iowa scores 53.02 on the County Distress Index — the middle fifth, 2nd in Iowa, 1,441st nationally. Burlington made backhoes for 87 years. The factory is closing. See the full breakdown.

"The Foundry"
Wallowa County, OR sits in the middle fifth of U.S. counties — 1,652nd of 3,144, 29th of 36 in Oregon. Unemployment at the 95th percentile, debt in collections at the 7th. A county that learned not to borrow. Home of the WWII Memorial’s bronze.

"The Filter"
King County, Washington lands in the second-least distressed fifth of U.S. counties — less distressed than 69% of them, 35th of 39 in Washington. But its Debt Burden domain scores 74.52. See the full five-domain breakdown.

"The Hill"
Los Alamos County scores 5.64 on the County Distress Index — the single least distressed of 3,144 U.S. counties, last of 33 in New Mexico. A $5.28 billion federal laboratory in a state ranked last for child wellbeing.
Most Distressed Counties
Full rankings → 1
Holmes County, MS Default & Legal
93.1 2 Petersburg city, VA Default & Legal
92.8 3 Coahoma County, MS Delinquency
92.7 4 East Carroll Parish, LA Labor
92.0 5 Washington County, MS Delinquency
92.0 6 Leflore County, MS Delinquency
91.9 7 Phillips County, AR Delinquency
91.2 8 Williamsburg County, SC Delinquency
90.7 9 Hancock County, GA Debt Burden (housing basis)
90.4 10 Morehouse Parish, LA Default & Legal
90.4 Browse by State
All 51 states →Louisiana
71.8 mean score
60 of 64 counties in the two most distressed fifths
Mississippi
69.9 mean score
73 of 82 counties in the two most distressed fifths
Florida
69.3 mean score
56 of 67 counties in the two most distressed fifths
South Carolina
66.5 mean score
36 of 46 counties in the two most distressed fifths
Arkansas
65.5 mean score
57 of 75 counties in the two most distressed fifths
Kentucky
64.7 mean score
98 of 120 counties in the two most distressed fifths
Arizona
64.4 mean score
12 of 15 counties in the two most distressed fifths
Georgia
63.3 mean score
119 of 159 counties in the two most distressed fifths
Delaware
63 mean score
2 of 3 counties in the two most distressed fifths
New Mexico
61.9 mean score
26 of 33 counties in the two most distressed fifths
Alabama
61.3 mean score
40 of 67 counties in the two most distressed fifths
District of Columbia
60.3 mean score
1 of 1 counties in the two most distressed fifths
Oklahoma
59.8 mean score
51 of 77 counties in the two most distressed fifths
West Virginia
58.8 mean score
31 of 55 counties in the two most distressed fifths
Tennessee
58 mean score
57 of 95 counties in the two most distressed fifths
Latest Analysis
All articles →Research
What If We'd Been Watching Savings Instead of Delinquencies?
How the personal savings rate led debt delinquency by 9 quarters in the historical test.
Analysis
AI Displacement and Household Default
A revised AI displacement analysis note that keeps AWI zones separate from family-method ADI facts.
Analysis
The FHA Signal Thesis, Reframed
A revised FHA signal thesis that keeps the borrower-split question while routing family-v1 ADI facts through the canonical layer.
Analysis
Household Distress Through the Family Lens
A revised quarterly ADI update note aligned to family-v1 domains and canonical facts.
Analysis
Retirement Cannibalization and Household Buffers
A revised retirement-withdrawal analysis note aligned to family-method ADI language.
Analysis
Savings and Defaults Moved on Different Clocks
A family-methodology update to the savings and delinquency lag research, with family-v1 ADI wording bound through canonical facts.
For journalists & researchers
Use this data
Downloadable CSV, embeddable maps, full methodology, and story angles for all counties and states.
Press & data kit → Behind on payments?
Get help now
Free assessment of your situation. HUD-approved counselors. Foreclosure guides for all 50 states. Step-by-step options.
Free assessment →American Distress Index
44.6 TypicalOn average, its inputs sit higher than in 45% of their own quarterly histories since 2005.
The national composite tracking household financial distress across five dimensions.
Explore the ADI →County Distress Index
0 – 100 score per countyCounty ranks and fifths built from five equal-weighted distress domains.
Methodology →Quarterly data drops. No spam.
County scores, ADI updates, and indicator alerts — delivered when the numbers move.
or Create an Account for full access
If this affects you, we can help. Get a free action plan ·
Call (307) 264-2992 Find help near you ·
Browse the Glossary
Prefer a nonprofit? HUD-approved housing counselors offer free foreclosure-prevention counseling (1-800-569-4287).