Bottom-Half Share of Household Wealth
Also tracked as The Bottom Half
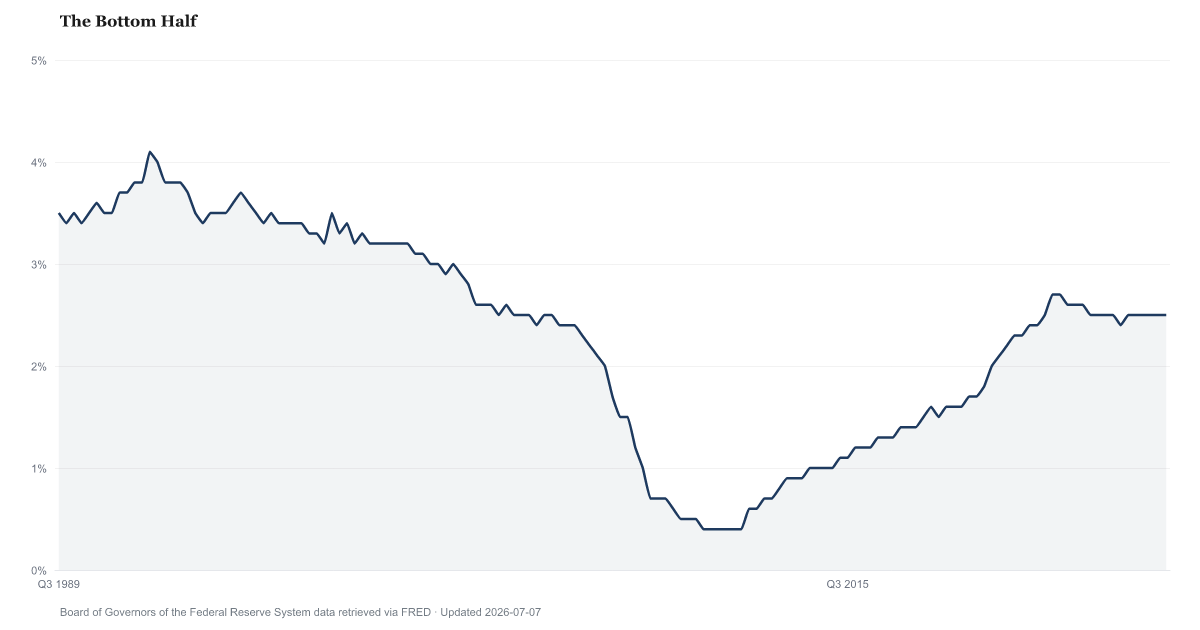
Share of household wealth held by the bottom 50 percent
What is the current Bottom-Half Share of Household Wealth reading?
According to the Board of Governors of the Federal Reserve System's Distributional Financial Accounts, U.S. households in the bottom half by wealth held 2.3% of total household net worth in Q2 2026. That is about the same as the 2.4% of Q2 2025. The latest quarters are model estimates that the Fed revises.
The half of U.S. households with the least wealth held 2.3% of all household net worth in Q2 2026, about the same as a year earlier, the Federal Reserve estimates.
The Federal Reserve's Distributional Financial Accounts rank U.S. households by net worth: what they own, such as homes, retirement accounts and cars, minus what they owe. For the bottom half, the two sides come close to cancelling out. Their share of total household net worth was 2.3% in Q2 2026. A year earlier it was 2.4%; a move that small can be revised away.
This is a share, not a dollar amount. The share can go down while the group's net worth in dollars goes up, if everyone else's wealth grows faster. It counts households, not people, and ranks them by wealth, not income. Net worth here leaves out Social Security.
The recent quarters are estimates, not new survey readings. The Fed spreads its national balance-sheet totals across groups using the Survey of Consumer Finances, which runs every three years. The latest wave used is from 2022, so later quarters are extended by models, and they are revised when new data arrive. A tenth of a point is within that revision range, so this page treats moves that small as about the same.
Bottom-Half Share of Household Wealth over time: what has changed?

Counties with the highest labor scores
These are labor scores from our County Distress Index, not county readings of Bottom-Half Share of Household Wealth.
Explore all 3,144 counties →| Period | Value | YoY Change |
|---|---|---|
| Q2 2026 | 2.3% | -0.1 pp |
| Q1 2026 | 2.4% | 0 pp |
| Q4 2025 | 2.4% | 0 pp |
| Q3 2025 | 2.4% | 0 pp |
| Q2 2025 | 2.4% | -0.1 pp |
| Q1 2025 | 2.4% | -0.1 pp |
| Q4 2024 | 2.4% | -0.1 pp |
| Q3 2024 | 2.4% | -0.2 pp |
| Q2 2024 | 2.5% | -0.1 pp |
| Q1 2024 | 2.5% | -0.1 pp |
| Q4 2023 | 2.5% | -0.1 pp |
| Q3 2023 | 2.6% | -0.1 pp |
Frequently Asked Questions
How much of U.S. wealth does the bottom half hold?
The Fed estimates that the half of U.S. households with the least wealth held 2.3% of all household net worth in Q2 2026. That is net worth, assets minus debts, and it excludes Social Security.
How has the share changed?
In Q2 2026 the share was 2.3%, about the same as a year earlier. Recent quarters are model estimates, so a change of a tenth of a point may not last through the Fed's next revision.
Does a lower share mean the bottom half got poorer?
Not necessarily. The share compares the group's net worth with the total. The Fed publishes the group's dollar net worth separately, and the share can go down in a quarter when that dollar amount goes up.
Why do other sources give a different bottom-half share?
Other estimates count people or adults instead of households, rank by income instead of wealth, or add Social Security. The Congressional Budget Office, for example, includes Social Security wealth for families. This series is the Fed's household estimate without it.

Quick poll
Is this affecting you or your household?
Discussion
Get the numbers when they move.
New data drops, indicator updates, and American Distress Index changes — delivered when it matters. No spam.
or Create an Account for full access
Loading comments…