Family Income Inequality (Gini)
Also tracked as The Divide
Family income inequality (Gini coefficient)
What is the current Family Income Inequality (Gini) reading?
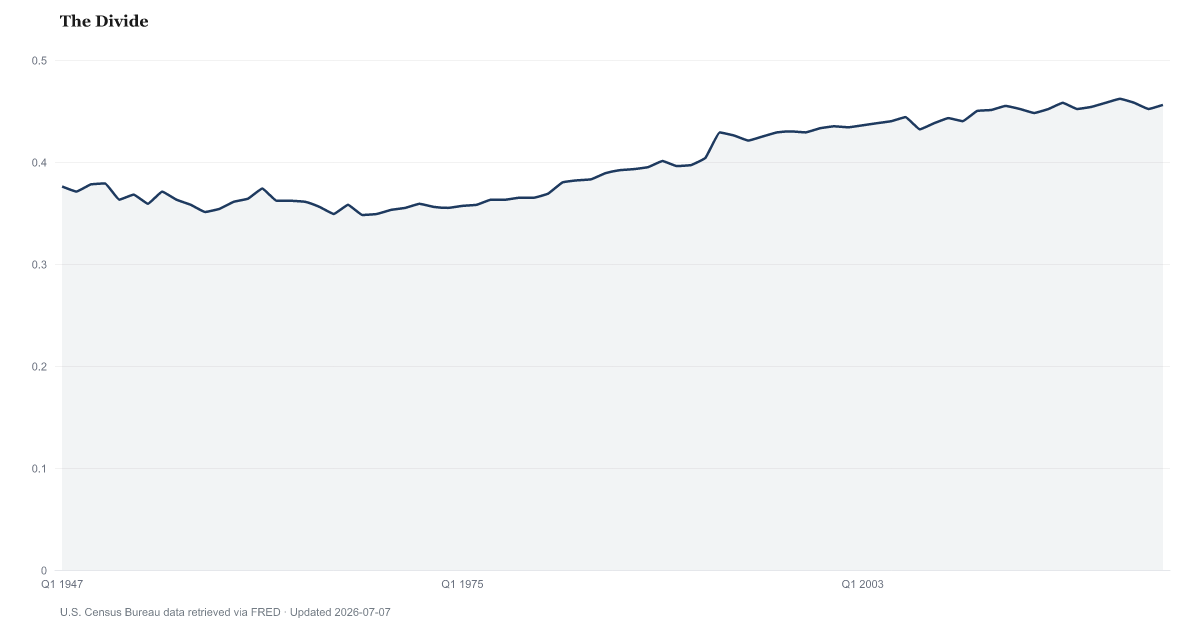
The Census Bureau's Gini index of family income was 0.46 in 2025. That is about the same as the 0.457 of 2024. A Gini of 0 would mean every family had the same pretax money income, and 1 would mean one family had all of it.
Income inequality among U.S. families measured 0.46 on the Gini scale in 2025, about the same as the year before.
The Gini index sums up how unevenly income is spread, on a scale from 0, where every family has the same income, to 1, where one family has all of it. The Census Bureau puts the figure for U.S. families at 0.46 for income received in 2025. It covers families of two or more related people living together, and it counts pretax money income such as wages, Social Security and interest.
Census prints no margin of error for the family Gini, so a change of a few thousandths from one year to the next cannot be called a real change. This page calls a move under about 1% 'about the same'.
The measure leaves out capital gains, tax credits such as the Earned Income Tax Credit, and noncash help such as food assistance and housing subsidies. It says nothing about wealth. It is also not the household Gini that Census headlines each September, which covers people living alone too and runs higher.
Census changed how it collected income for 1993, and it says comparisons across 1992 and 1993 should be avoided. It also revised its questions in 2013 and its processing in 2017, publishing two estimates for each of those years. The chart marks those breaks, and this page makes no comparison across them.
Family Income Inequality (Gini) over time: what has changed?

Counties with the highest labor scores
These are labor scores from our County Distress Index, not county readings of Family Income Inequality (Gini).
Explore all 3,144 counties →| Period | Value | YoY Change |
|---|---|---|
| 2025 | 0.46 | +0.003 |
| 2024 | 0.457 | +0.005 |
| 2023 | 0.452 | -0.006 |
| 2022 | 0.458 | -0.004 |
| 2021 | 0.462 | +0.004 |
| 2020 | 0.458 | +0.004 |
| 2019 | 0.454 | +0.002 |
| 2018 | 0.452 | -0.006 |
| 2017 | 0.458 | — |
| 2016 | 0.452 | +0.004 |
| 2015 | 0.448 | -0.004 |
| 2014 | 0.452 | -0.003 |
How to read this series
The source changed how it measures this in 1993. Census changed its income collection method and raised reporting limits for 1993 data, and says comparisons of income inequality that bridge 1992 and 1993 should be avoided. Readings on either side are not directly comparable, so the year-over-year column stays blank where a comparison would cross that date. Source documentation.
The source changed how it measures this in 2013. Census Table F-4 gives two 2013 family Gini estimates, from the legacy and the redesigned income questions; the stored 2013 value is the redesigned estimate, comparable with later years, not earlier ones. Readings on either side are not directly comparable, so the year-over-year column stays blank where a comparison would cross that date. Source documentation.
The source changed how it measures this in 2017. Census Table F-4 gives two 2017 family Gini estimates; the stored updated-processing value (0.458) is for comparison with 2018 and later, and the legacy value (0.449) for earlier years. Readings on either side are not directly comparable, so the year-over-year column stays blank where a comparison would cross that date. Source documentation.
Frequently Asked Questions
What is the family income Gini index?
It is a number from 0 to 1 that shows how unevenly income is spread across U.S. families. Census put it at 0.46 for 2025. It is a ratio, not a percent.
How has family income inequality changed?
For 2025 the Gini was 0.46, about the same as the 0.457 of 2024. It is the highest reading since 2021, when it was 0.462.
Why does Census report a different Gini in its income report?
The Gini that Census headlines each September is for households, which include people living alone. This page tracks the family Gini from Census Table F-4, which covers only families of two or more related people and runs lower. Census also publishes post-tax and size-adjusted versions, which differ again.
Where does this data come from?
The Census Bureau's Current Population Survey Annual Social and Economic Supplement, a survey fielded from February to April. Each September Census publishes the figure for the previous calendar year's income.

Quick poll
Is this affecting you or your household?
Discussion
Get the numbers when they move.
New data drops, indicator updates, and American Distress Index changes — delivered when it matters. No spam.
or Create an Account for full access
Loading comments…