Labor Share of Nonfarm Business Output
Also tracked as The Split
BLS seasonally adjusted labor-share index, 2017=100
What is the current Labor Share of Nonfarm Business Output reading?
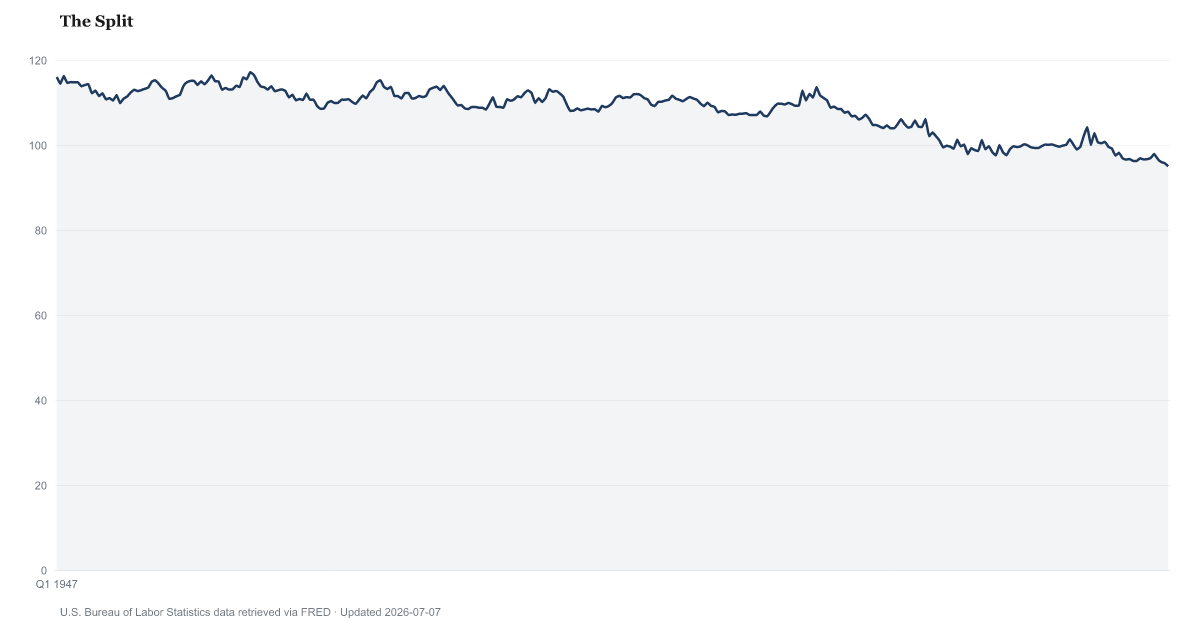
The Bureau of Labor Statistics' labor-share index for the nonfarm business sector was 93.4 in Q2 2026, with 2017 set to 100. That is down from 94.8 in Q1 2026. It measures total worker compensation as a share of the sector's output, shown as an index rather than a percent.
Measurement basis: Seasonally adjusted BLS index of labor share for all workers in the nonfarm business sector, with 2017=100 (series PRS85006173). The level is an index, not a percentage of income or output.
The BLS index of labor's share of nonfarm business output was 93.4 in Q2 2026, the lowest in current BLS estimates going back to 1947.
The labor share compares what businesses pay workers with the value of what they produce. The Bureau of Labor Statistics divides total labor compensation in the nonfarm business sector by that sector's output, both in current dollars, and publishes the result as a seasonally adjusted index with 2017 set to 100. It stood at 93.4 in Q2 2026. In Q1 2026 it was 94.8. A year earlier, in Q2 2025, the index was 96.7.
The index is not a percent. A reading below 100 means the share is smaller than it was on average in 2017, not that workers received that percent of output. BLS also publishes the same measure as a percent of output, a much smaller number that this page does not chart.
Compensation here is more than wages: it includes benefits, employer taxes and an estimate of what self-employed owners earn for their own work. The base is nonfarm business output, which leaves out government, nonprofits, households and farms, so this is not labor's share of GDP or of national income. The share can go down while pay goes up, if output grows more.
BLS publishes a preliminary figure about 40 days after each quarter ends and revises it twice, so recent quarters can change. BLS gives no cause for moves in the share.
Labor Share of Nonfarm Business Output over time: what has changed?

Counties with the highest labor scores
These are labor scores from our County Distress Index, not county readings of Labor Share of Nonfarm Business Output.
Explore all 3,144 counties →| Period | Value | YoY Change |
|---|---|---|
| Q2 2026 | 93.4 | -3.3 |
| Q1 2026 | 94.8 | -3.1 |
| Q4 2025 | 95.7 | -1.2 |
| Q3 2025 | 96 | -0.7 |
| Q2 2025 | 96.7 | +0.1 |
| Q1 2025 | 97.9 | +1 |
| Q4 2024 | 96.9 | +0.7 |
| Q3 2024 | 96.7 | +0.4 |
| Q2 2024 | 96.6 | -0.1 |
| Q1 2024 | 96.9 | +0.3 |
| Q4 2023 | 96.2 | -0.7 |
| Q3 2023 | 96.3 | -1.9 |
Frequently Asked Questions
What is the labor share?
It is the share of the nonfarm business sector's output that goes to workers as compensation, including wages, benefits and employer taxes. BLS reports it here as an index with 2017 = 100; the Q2 2026 reading was 93.4.
How has the labor share changed?
The index was 93.4 in Q2 2026, down from 94.8 in Q1 2026. It is the lowest reading in current BLS estimates for the nonfarm business sector, which begin in 1947; recent quarters are still subject to revision.
Does a lower labor share mean workers are paid less?
Not necessarily. The share compares compensation with output. Pay can rise while the share falls, if output grows more. The share is also one total for the whole sector, so it says nothing about how pay is split among workers.
Is this labor's share of GDP?
No. The base is output of the nonfarm business sector, which leaves out government, nonprofits, households and farms. Other labor-share measures, such as the nonfinancial corporate share or the Penn World Table share of GDP, are different series with different numbers.

Quick poll
Is this affecting you or your household?
Discussion
Get the numbers when they move.
New data drops, indicator updates, and American Distress Index changes — delivered when it matters. No spam.
or Create an Account for full access
Loading comments…