Union Membership Rate
Also tracked as The Union Card
Union membership rate
What is the current Union Membership Rate reading?
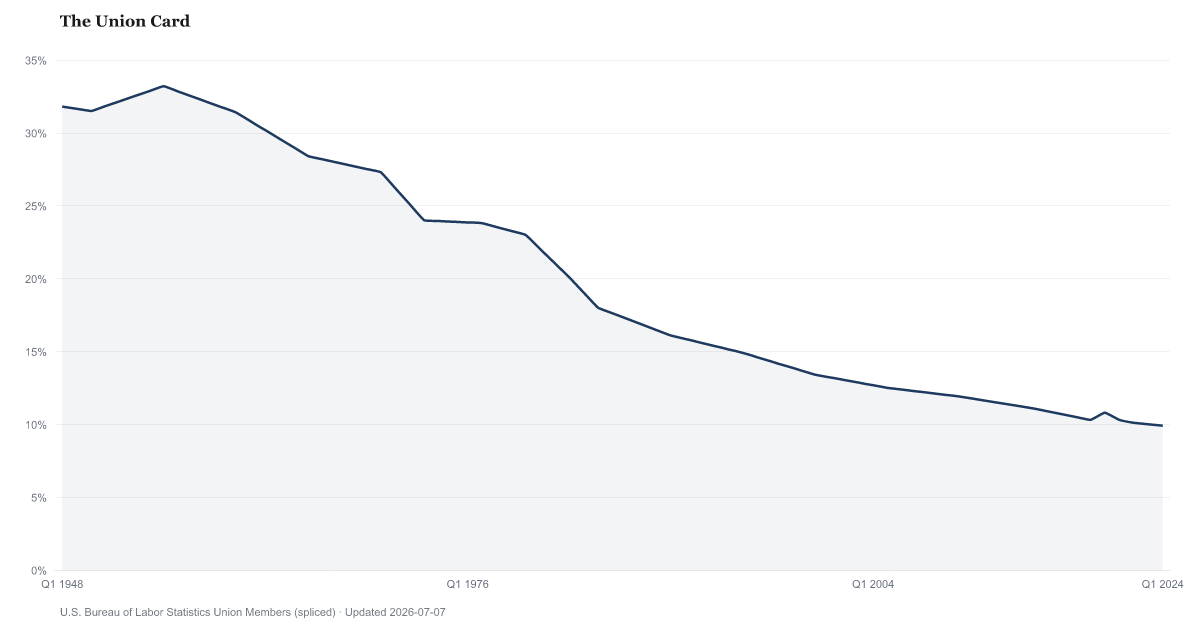
In 2025, 10% of employed U.S. wage and salary workers were members of a union or a similar employee association, according to the U.S. Bureau of Labor Statistics. That is little changed from 9.9% in 2024. BLS publishes the rate once a year, usually in late January, from the Current Population Survey.
Union members were 10% of U.S. wage and salary workers in 2025.
The Bureau of Labor Statistics counts a worker as a union member if they say yes when asked whether, on their job, they belong to a labor union or a similar employee association. The 2025 rate is an annual average from the Current Population Survey, the monthly household survey that also produces the unemployment rate. It was 9.9% in 2024; a move this small is within the survey's sampling error.
That 2025 average covers only 11 months: the October 2025 survey was not collected, so BLS says 2025 is not strictly comparable with other years.
Members are not the same as workers covered by a union contract. BLS counts covered workers who are not members separately, as represented workers. The rate covers private and public jobs together, and it leaves out the self-employed, so it is not a share of all workers.
A change in the rate is not the same as a change in the number of members. The rate went up in 2020 even though there were fewer members, because there were far fewer wage and salary jobs overall, BLS says. In 2022 the rate went down while the number of members grew.
Union Membership Rate over time: what has changed?

Counties with the highest labor scores
These are labor scores from our County Distress Index, not county readings of Union Membership Rate.
Explore all 3,144 counties →| Period | Value | YoY Change |
|---|---|---|
| 2025 | 10% | +0.1 pp |
| 2024 | 9.9% | -0.1 pp |
| 2023 | 10% | -0.1 pp |
| 2022 | 10.1% | -0.2 pp |
| 2021 | 10.3% | -0.5 pp |
| 2020 | 10.8% | +0.5 pp |
| 2019 | 10.3% | -0.2 pp |
| 2018 | 10.5% | -0.2 pp |
| 2017 | 10.7% | 0 pp |
| 2016 | 10.7% | -0.4 pp |
| 2015 | 11.1% | 0 pp |
| 2014 | 11.1% | -0.2 pp |
Frequently Asked Questions
What share of U.S. workers belong to a union?
BLS puts the 2025 union membership rate at 10% of employed wage and salary workers. Self-employed people and people without jobs are not in the count, so it is not a share of all workers or of all Americans.
How has union membership changed?
The 2025 rate was 10%, little changed from 9.9% in 2024.
What is the difference between union members and represented workers?
Union members said yes when asked if they belong to a union or similar employee association on their job. Represented workers also include people who are not members but whose jobs are covered by a union or association contract, so the represented share is always the larger of the two.
When does BLS publish union membership data?
Once a year, in its Union Members news release. Most releases come out in late January for the year before, though some have come out in February.

Quick poll
Is this affecting you or your household?
Discussion
Get the numbers when they move.
New data drops, indicator updates, and American Distress Index changes — delivered when it matters. No spam.
or Create an Account for full access
Loading comments…