Productivity-Pay Wedge
Also tracked as The Wedge
Output per hour divided by inflation-adjusted hourly pay, both indexed to 2017 = 100
What is the current Productivity-Pay Wedge reading?
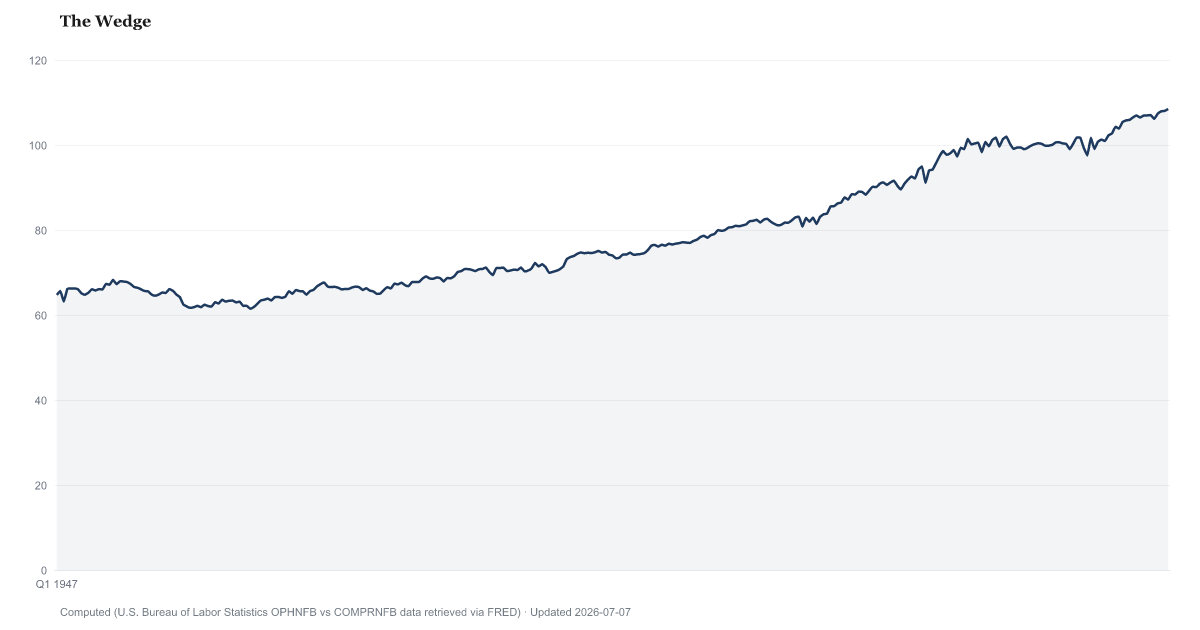
The productivity-pay wedge was 109.9 in Q2 2026, up from 107.4 a year earlier. It is American Default Research's ratio of two U.S. Bureau of Labor Statistics indexes for the nonfarm business sector, output per hour and real hourly compensation, both set to 100 in 2017. Above 100, the productivity index stands above the real-pay index. Source: BLS productivity and costs (OPHNFB, COMPRNFB).
American Default Research's productivity-pay wedge, a ratio of two Bureau of Labor Statistics indexes, read 109.9 in Q2 2026, up from 107.4 a year earlier.
A quarter earlier, in Q1 2026, the wedge was 108.6. The latest reading is the highest in the current, revised data, which start in 1947.
The wedge divides two Bureau of Labor Statistics indexes for the nonfarm business sector: output per hour worked, and hourly compensation adjusted for consumer prices. Both are set to 100 in 2017. Above 100, the productivity index stands above the real-pay index; below 100, the real-pay index is the one on top. It is a ratio of growth since 2017, not a gap in dollars or a percent of pay withheld. BLS publishes the two indexes; American Default Research computes the ratio.
Nonfarm business leaves out government, nonprofits, households and farms, about a quarter of the economy. It counts everyone working in the sector, including managers and the self-employed, so it is not the pay of a typical worker. Compensation includes benefits and employer payroll taxes as well as wages. Output is measured with the sector's own prices while pay is adjusted with consumer prices, so any gap between those two price measures shows up in the ratio as well. It does not by itself show a shrinking share of income going to workers.
BLS revises each quarter twice in the months after its first estimate, and revises years of history when output and payroll benchmarks are updated. Revisions have changed a single quarter of this ratio by more than a point within weeks, so quarter-to-quarter moves of about a point are described here as little changed. Long comparisons also mix deflators: BLS uses a research consumer price index (CPI-U-RS) for 1978 onward and the CPI-U for the latest quarters.
A separate page tracks the labor share, the part of nonfarm business output paid to workers as compensation. It is a separate BLS series and need not move with the wedge. The Economic Policy Institute's productivity-pay gap uses different inputs, total-economy productivity and production-worker pay, so its figures are not this series.
Productivity-Pay Wedge over time: what has changed?

Counties with the highest labor scores
These are labor scores from our County Distress Index, not county readings of Productivity-Pay Wedge.
Explore all 3,144 counties →| Period | Value | YoY Change |
|---|---|---|
| Q2 2026 | 109.9 | +2.5 |
| Q1 2026 | 108.6 | +2.5 |
| Q4 2025 | 108 | +1 |
| Q3 2025 | 107.9 | +0.9 |
| Q2 2025 | 107.4 | +0.5 |
| Q1 2025 | 106.1 | -0.4 |
| Q4 2024 | 107 | +0.1 |
| Q3 2024 | 107 | +0.5 |
| Q2 2024 | 106.9 | +1 |
| Q1 2024 | 106.5 | +0.7 |
| Q4 2023 | 106.9 | +1.5 |
| Q3 2023 | 106.5 | +2.6 |
Frequently Asked Questions
What does a wedge reading above 100 mean?
The latest reading, for Q2 2026, is 109.9. That is higher than a year earlier, when it was 107.4. Above 100, BLS's output-per-hour index stands above its real hourly compensation index, both counted from 2017. It does not mean workers are paid that percent less than they produce.
Is this the same as the Economic Policy Institute's productivity-pay gap?
No. EPI compares total-economy net productivity with the pay of production and nonsupervisory workers, adjusting both with one price index. This wedge uses BLS's nonfarm business output per hour and the hourly compensation of everyone in that sector, adjusted with consumer prices.
Does it measure wages?
Not only wages. Compensation includes wages and salaries plus benefits, employer contributions to benefit plans and payroll taxes, and it covers managers and the self-employed as well as rank-and-file workers.
Where does this data come from?
Both indexes come from BLS's quarterly Productivity and Costs release, built from U.S. Bureau of Economic Analysis output data and BLS hours and pay data. American Default Research divides one by the other. BLS publishes a preliminary estimate about five weeks after each quarter and revises it later.

Quick poll
Is this affecting you or your household?
Discussion
Get the numbers when they move.
New data drops, indicator updates, and American Distress Index changes — delivered when it matters. No spam.
or Create an Account for full access
Loading comments…