Real Federal Minimum Wage
Also tracked as The Floor
Real federal minimum wage
What is the current Real Federal Minimum Wage reading?
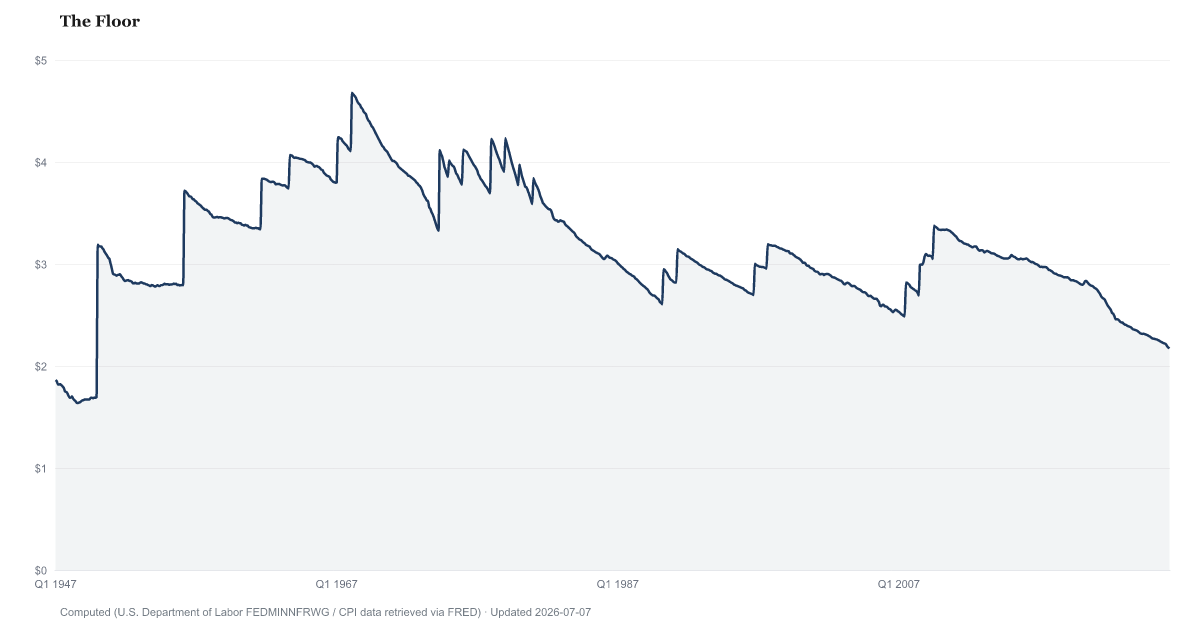
The real federal minimum wage was $2.17 in August 2026, down from $2.24 a year earlier, by American Default Research's calculation from U.S. Department of Labor and U.S. Bureau of Labor Statistics data. That is the $7.25 legal rate expressed in 1982-84 dollars using the Consumer Price Index (CPI-U), so it shows what the wage buys, not what anyone is paid.
Adjusted for inflation, the $7.25 federal minimum wage was worth $2.17 in 1982-84 dollars in August 2026, down from $2.24 a year earlier.
A month earlier, in July 2026, it was worth $2.18. The latest reading is the lowest value since December 1949.
The figure is the federal minimum wage of $7.25 an hour, the rate since July 24, 2009, divided by the Consumer Price Index for all urban consumers (CPI-U). It says what $7.25 would have bought at 1982-84 prices. No one is paid the figure shown; the legal rate is still $7.25. Because the dollar rate has not changed since 2009, every change since then comes from consumer prices, not from the law.
It is one national rate. Thirty states and the District of Columbia required more than $7.25 as of 2024, according to the Bureau of Labor Statistics, and where a state or city minimum is higher, that rate applies. Tipped workers can be paid a lower cash wage if tips make up the difference, and some young workers, students and workers with disabilities can be paid less. The series counts no workers: it is the buying power of one hourly rate, not anyone's income.
The series starts in January 1947, the first month of the CPI-U data used here. Before 1978 it is the rate for workers first covered by the 1938 law; groups added in 1961 and 1966 had lower rates for some years. Other price indexes, such as the ones the Economic Policy Institute uses, give different long-run comparisons, so figures from those sources are not this series. There is no value for October 2025, when BLS did not collect consumer prices during the federal government shutdown.
Real production-worker pay tracks what non-managers actually earn per hour after inflation, and the CPI Inflation Rate tracks the price index this page divides by.
Real Federal Minimum Wage over time: what has changed?

Counties with the highest labor scores
These are labor scores from our County Distress Index, not county readings of Real Federal Minimum Wage.
Explore all 3,144 counties →| Period | Value | YoY Change |
|---|---|---|
| Aug 2026 | $2.17 | -$0.07 |
| Jul 2026 | $2.18 | -$0.07 |
| Jun 2026 | $2.18 | -$0.08 |
| May 2026 | $2.17 | -$0.09 |
| Apr 2026 | $2.18 | -$0.08 |
| Mar 2026 | $2.2 | -$0.07 |
| Feb 2026 | $2.21 | -$0.06 |
| Jan 2026 | $2.22 | -$0.05 |
| Dec 2025 | $2.22 | -$0.06 |
| Nov 2025 | $2.23 | -$0.06 |
| Sep 2025 | $2.24 | -$0.06 |
| Aug 2025 | $2.24 | -$0.07 |
Frequently Asked Questions
What is the federal minimum wage worth after inflation?
In August 2026, $7.25 an hour was worth $2.17 in 1982-84 dollars. That is less than a year earlier, when it was worth $2.24. The legal rate has been $7.25 since July 2009, so the change comes from prices.
Does anyone earn this amount?
No. The legal federal minimum is $7.25 an hour. This page restates it in 1982-84 dollars so that different years can be compared on the same prices.
Why does it differ from other estimates of the minimum wage's real value?
Each estimate depends on the price index used. This series divides by the CPI-U with 1982-84 as the base. Groups such as the Economic Policy Institute use other price series, which give different results for the same months.
Where does this data come from?
The wage comes from the Department of Labor's federal minimum wage series and the price index from the Bureau of Labor Statistics, both via the St. Louis Fed's FRED database. A new month can be computed when BLS publishes that month's CPI, about two weeks after the month ends.

Quick poll
Is this affecting you or your household?
Discussion
Get the numbers when they move.
New data drops, indicator updates, and American Distress Index changes — delivered when it matters. No spam.
or Create an Account for full access
Loading comments…