Real Production & Nonsupervisory Wage
Also tracked as Shop Floor Pay
Real production and nonsupervisory wage
What is the current Real Production & Nonsupervisory Wage reading?
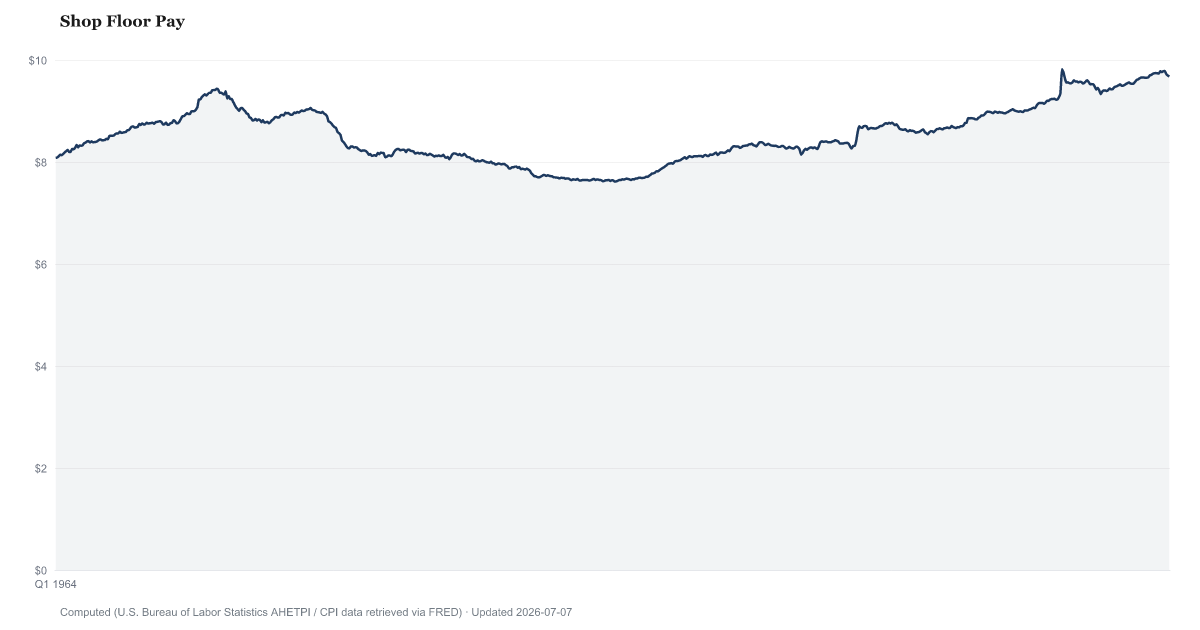
By American Default Research's calculation from U.S. Bureau of Labor Statistics data, average hourly earnings of U.S. private-sector production and nonsupervisory employees were $9.74 in 1982-84 dollars in August 2026, the same as a year earlier. The calculation divides BLS's average hourly earnings for this group (AHETPI) by the CPI-U. The figure is an average over jobs, before taxes, not what a typical worker earns.
Private-sector non-managers averaged $9.74 an hour in 1982-84 dollars in August 2026, the same as a year earlier.
A month earlier, in July 2026, the figure was the same.
The figure is BLS's average hourly earnings for production and nonsupervisory jobs on private payrolls, divided by the Consumer Price Index for all urban consumers (CPI-U) so that every month is in 1982-84 dollars. The group is about four in five private-sector jobs: production workers in factories, mines and construction, and non-managers in service industries, from cashiers and drivers to nurses, teachers and accountants. Government, farm and self-employed workers are left out. Pay is before taxes, includes overtime, and has included tips in most service industries since 2007.
This is an average over jobs, so it shifts when the mix of higher- and lower-paid jobs changes, not only when pay rates change. In April 2020, heavy job losses among lower-paid workers pushed it to a peak that BLS said did not reflect higher pay; April to June 2020 are left out of comparisons here. The latest two months are preliminary and are revised, and revisions have changed values by up to about 5 cents, so moves under 6 cents are described here as little changed.
BLS's own real earnings figure for this group divides by a different price index, the CPI-W for wage earners and clerical workers, so its level is not the same as this page's. Comparisons that reach back decades rely on an older CPI-U history that BLS has not revised for later changes in method, so long-run comparisons carry that caveat. There is no value for October 2025, when BLS did not collect consumer prices during the federal government shutdown.
Real Median Weekly Earnings is a median of full-time workers' weekly pay from the household survey, a different measure. The Real Federal Minimum Wage uses the same CPI-U and base years, and the Productivity-Pay Wedge compares pay for all workers with output per hour.
Real Production & Nonsupervisory Wage over time: what has changed?

Counties with the highest labor scores
These are labor scores from our County Distress Index, not county readings of Real Production & Nonsupervisory Wage.
Explore all 3,144 counties →| Period | Value | YoY Change |
|---|---|---|
| Aug 2026 | $9.74 | $0 |
| Jul 2026 | $9.74 | $0 |
| Jun 2026 | $9.74 | $0 |
| May 2026 | $9.67 | -$0.06 |
| Apr 2026 | $9.7 | -$0.01 |
| Mar 2026 | $9.72 | +$0.02 |
| Feb 2026 | $9.78 | +$0.12 |
| Jan 2026 | $9.78 | +$0.13 |
| Dec 2025 | $9.76 | +$0.11 |
| Nov 2025 | $9.78 | +$0.13 |
| Sep 2025 | $9.73 | +$0.07 |
| Aug 2025 | $9.74 | +$0.1 |
Frequently Asked Questions
What do production and nonsupervisory workers earn after inflation?
The latest figure, for August 2026, is $9.74 an hour in 1982-84 dollars. That matches the figure a year earlier. In today's dollars the same hour's pay is several times larger; the 1982-84 base lets every month be compared on the same prices.
Is this blue-collar pay?
Only partly. Production and nonsupervisory jobs are about four in five private-sector jobs. They include factory and construction workers, but also non-managers in services such as retail clerks, nurses, teachers, accountants and restaurant workers.
Why does this differ from BLS's real earnings figure?
BLS adjusts this group's pay with the CPI-W, a price index for wage-earner and clerical households. This page uses the broader CPI-U, so the dollar level differs and the monthly changes can too.
Where does this data come from?
Average hourly earnings come from BLS's monthly survey of employers, published in the Employment Situation report. The CPI-U comes out about a week later, and the month can be computed then. American Default Research divides one by the other.

Quick poll
Is this affecting you or your household?
Discussion
Get the numbers when they move.
New data drops, indicator updates, and American Distress Index changes — delivered when it matters. No spam.
or Create an Account for full access
Loading comments…