Real Median Weekly Earnings
Also tracked as The Median Check
Real median weekly earnings, full-time workers
What is the current Real Median Weekly Earnings reading?
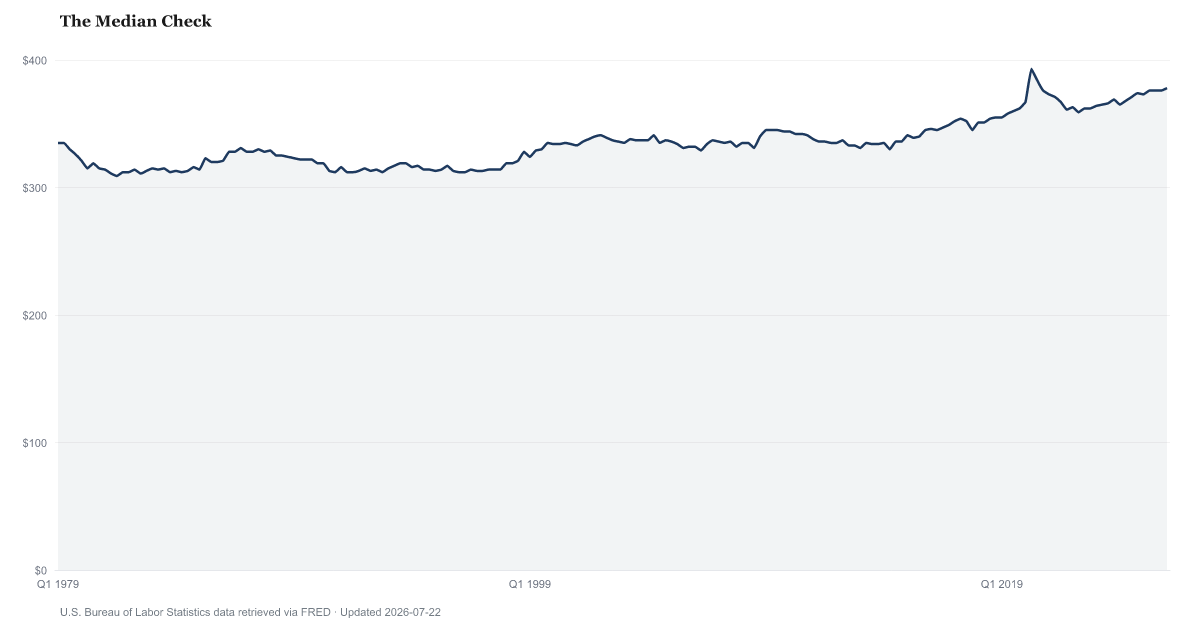
Real median weekly earnings of U.S. full-time wage and salary workers were $378 in Q2 2026, little changed from $376 a year earlier, according to the U.S. Bureau of Labor Statistics. The figure is in constant 1982-84 dollars, before taxes, for the worker in the middle of the pay scale. Source: BLS Current Population Survey (LES1252881600Q).
The median full-time worker earned $378 a week in Q2 2026, in 1982-84 dollars, little changed from $376 a year earlier.
A quarter earlier, in Q1 2026, the median was $376, little changed. The latest reading is the highest since the survey was redesigned in 1994, leaving out the pandemic quarters of 2020 and 2021, when job losses among lower-paid workers pushed the median up.
The median is the full-time worker in the middle: half earn more and half earn less. It covers wage and salary workers who usually work 35 hours or more a week at their main job, in private companies and government. Self-employed people and part-time workers are left out. Earnings are before taxes and include overtime, commissions and tips. BLS converts the figure to 1982-84 dollars with the Consumer Price Index (CPI-U), so it is much smaller than a paycheck stated in today's dollars.
The median is measured on whoever is working that quarter. If lower-paid workers lose jobs, the median can rise without anyone getting a raise, which is what happened in 2020. That is why the quarters from April 2020 through 2021 are left out of comparisons here. The figure is seasonally adjusted, which removes the usual swings of the calendar, and comes from a sample of households. BLS publishes no margin of error for it, and revisions have changed single quarters by a few dollars, so moves under $3 are described here as little changed.
Comparisons on this page start in 1994, when BLS redesigned the survey questionnaire and let people report their pay in whatever time frame was easiest; in a side-by-side test the new questions gave a somewhat higher median. There is no estimate for the fourth quarter of 2025, because the survey did not run in October 2025 during the federal government shutdown. BLS revises the last five years of seasonally adjusted figures once a year.
BLS's real average weekly earnings, from its separate survey of employers, is an average over all private jobs rather than a median of full-time workers. Real production-worker pay is an hourly average for non-managers from that same employer survey. The Atlanta Fed Wage Growth Tracker follows the same people's pay changes and is not the growth of this median.
Real Median Weekly Earnings over time: what has changed?

Counties with the highest labor scores
These are labor scores from our County Distress Index, not county readings of Real Median Weekly Earnings.
Explore all 3,144 counties →| Period | Value | YoY Change |
|---|---|---|
| Q2 2026 | $378 | +$2 |
| Q1 2026 | $376 | +$3 |
| Q3 2025 | $376 | +$5 |
| Q2 2025 | $376 | +$8 |
| Q1 2025 | $373 | +$8 |
| Q4 2024 | $374 | +$5 |
| Q3 2024 | $371 | +$5 |
| Q2 2024 | $368 | +$3 |
| Q1 2024 | $365 | +$1 |
| Q4 2023 | $369 | +$7 |
| Q3 2023 | $366 | +$4 |
| Q2 2023 | $365 | +$6 |
How to read this series
The source changed how it measures this in Q1 1994. BLS redesigned the Current Population Survey questionnaire in January 1994, letting people report earnings in the time frame easiest for them; in the 1993 parallel survey the full-time median came out somewhat higher under the new questions, so earlier values are not like-for-like. Readings on either side are not directly comparable, so the year-over-year column stays blank where a comparison would cross that date. Source documentation.
Frequently Asked Questions
What are real median weekly earnings now?
BLS's latest figure, for Q2 2026, is $378 a week in 1982-84 dollars. That is little changed from a year earlier, when it was $376. Stated in today's dollars the same paycheck is several times larger; the 1982-84 base keeps every quarter comparable after inflation.
Is this what the typical American earns?
No. It covers full-time wage and salary workers only, at their main job, before taxes. Part-time workers, the self-employed and people without jobs are left out, and it is one worker's weekly pay, not household income.
Why are 2020 and 2021 left out of comparisons?
In 2020 job losses fell hardest on lower-paid workers, so the median of those still working jumped even though pay for the same workers did not. BLS said so at the time. Comparing against the quarters from April 2020 through 2021 would mix that shift in who was working with changes in pay.
Where does this data come from?
BLS publishes it each quarter in its Usual Weekly Earnings release, about three weeks after the quarter ends. It comes from the Current Population Survey, a survey of about 60,000 households that the Census Bureau runs for BLS; earnings questions go to a quarter of the sample.

Quick poll
Is this affecting you or your household?
Discussion
Get the numbers when they move.
New data drops, indicator updates, and American Distress Index changes — delivered when it matters. No spam.
or Create an Account for full access
Loading comments…