Atlanta Fed Wage Growth Tracker (1st Quartile)
Median yearly wage growth for workers in the bottom wage quartile
What is the current Atlanta Fed Wage Growth Tracker (1st Quartile) reading?
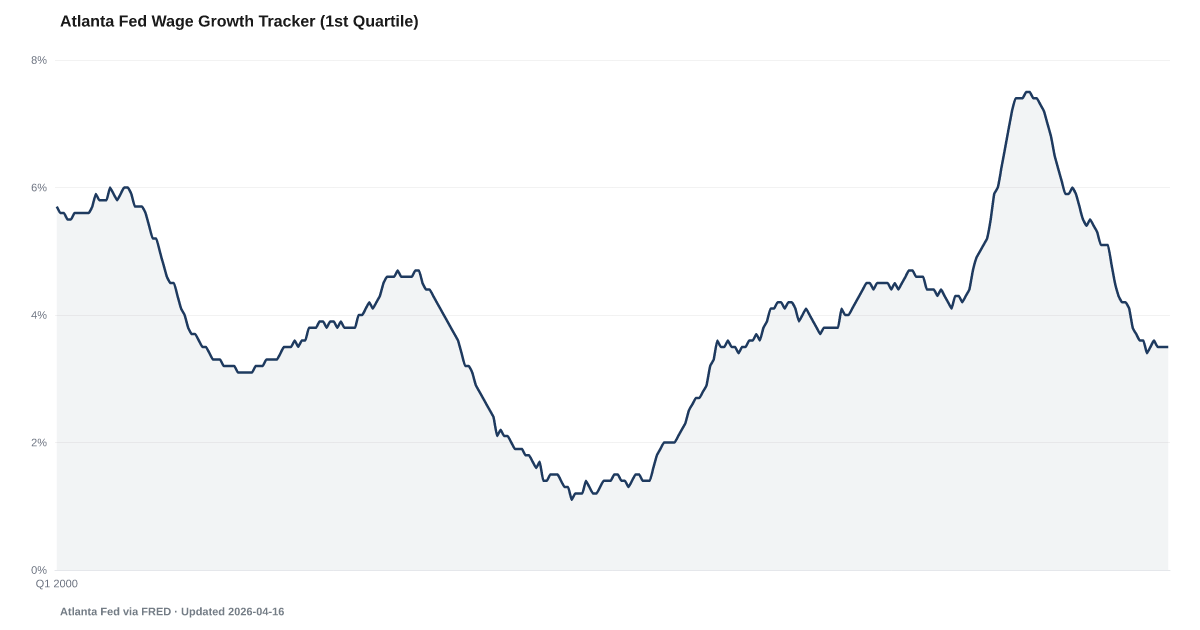
Median yearly wage growth for U.S. workers in the bottom wage quartile was 3.7% in August 2026, up from 3.4% a year earlier, according to the Federal Reserve Bank of Atlanta's Wage Growth Tracker. It is the median change in hourly pay for the same workers a year apart, averaged over 12 months and not adjusted for inflation. Source: Federal Reserve Bank of Atlanta data retrieved via FRED.
Median pay growth for U.S. workers in the bottom wage quartile was 3.7% in August 2026, the highest since May 2025.
The Atlanta Fed's Wage Growth Tracker put the lowest quartile at 3.7% for August 2026. A reading above zero means the typical worker in the group was earning more per hour than a year earlier, not counting inflation. The rate is up from 3.4% in August 2025.
The tracker compares each person with themselves. The Census Bureau's Current Population Survey asks about earnings twice, a year apart. The Atlanta Fed matches the two answers, works out each person's change in hourly pay, ranks people by their average hourly wage across the two years and takes the median change in the lowest quarter. Each month's group is a different set of people. The figure shown is a 12-month average of those monthly medians, so it smooths out noise but reacts slowly when wage growth turns. It is the median of individual raises, not the growth of the median wage.
The group is wage and salary earners with earnings at both interviews. Self-employed people, people who lost their jobs and people who changed address are not in it, and the matched sample leans slightly toward older, more educated workers. People are ranked by their own hourly wage, not households by income. The figures are nominal, meaning not adjusted for inflation; a separate page subtracts CPI inflation from this series each year.
The Atlanta Fed revises its history. Its September 2026 release changed values back to 1997 by up to 0.3 percentage point (points on the percent scale, not a percent of the rate), so this page calls a year-over-year change under 0.3 point about the same. A Census change to how top earnings are coded entered the data in April 2024; the Atlanta Fed judged its effect likely modest. The survey did not run in October 2025, during the federal government shutdown, so there is no figure for that month, and October 2026 will have none either.
Explore Further
Is this happening to you?
Did the lowest-paid workers you know get a raise this year?
Atlanta Fed Wage Growth Tracker (1st Quartile) over time: what has changed?

Counties with the highest labor scores
These are labor scores from our County Distress Index, not county readings of Atlanta Fed Wage Growth Tracker (1st Quartile).
Explore all 3,144 counties →| Period | Value | YoY Change |
|---|---|---|
| Aug 2026 | 3.7% | +0.3 pp |
| Jul 2026 | 3.7% | +0.1 pp |
| Jun 2026 | 3.6% | 0 pp |
| May 2026 | 3.5% | -0.2 pp |
| Apr 2026 | 3.6% | -0.2 pp |
| Mar 2026 | 3.5% | -0.6 pp |
| Feb 2026 | 3.5% | -0.7 pp |
| Jan 2026 | 3.5% | -0.7 pp |
| Dec 2025 | 3.5% | -0.8 pp |
| Nov 2025 | 3.6% | -0.9 pp |
| Sep 2025 | 3.5% | -1.6 pp |
| Aug 2025 | 3.4% | -1.7 pp |
Frequently Asked Questions
What is the latest wage growth for the lowest-paid quartile?
The Atlanta Fed's figure for August 2026 is 3.7%, a 12-month average. That is the highest since May 2025.
Does this show low-wage pay keeping up with inflation?
Not by itself. The tracker measures pay growth before inflation. A real comparison needs a price measure alongside it; The K-Shape page subtracts CPI inflation from this series for each year.
Is this the Atlanta Fed's headline wage growth number?
No. The headline tracker covers matched workers at every wage level and uses a 3-month average. This series covers only the bottom wage quartile and uses a 12-month average, so the two numbers differ.
Where does this data come from?
The Federal Reserve Bank of Atlanta computes it from Current Population Survey microdata, which the Census Bureau collects for BLS. The Atlanta Fed usually updates it by the second Friday of the month, and FRED carries it as series FRBATLWGT12MMUMHWGWD1WP.


Quick poll
Is this affecting you or your household?
Discussion
Get the numbers when they move.
New data drops, indicator updates, and American Distress Index changes — delivered when it matters. No spam.
or Create an Account for full access
Loading comments…