Homelessness: HUD Point-in-Time Count
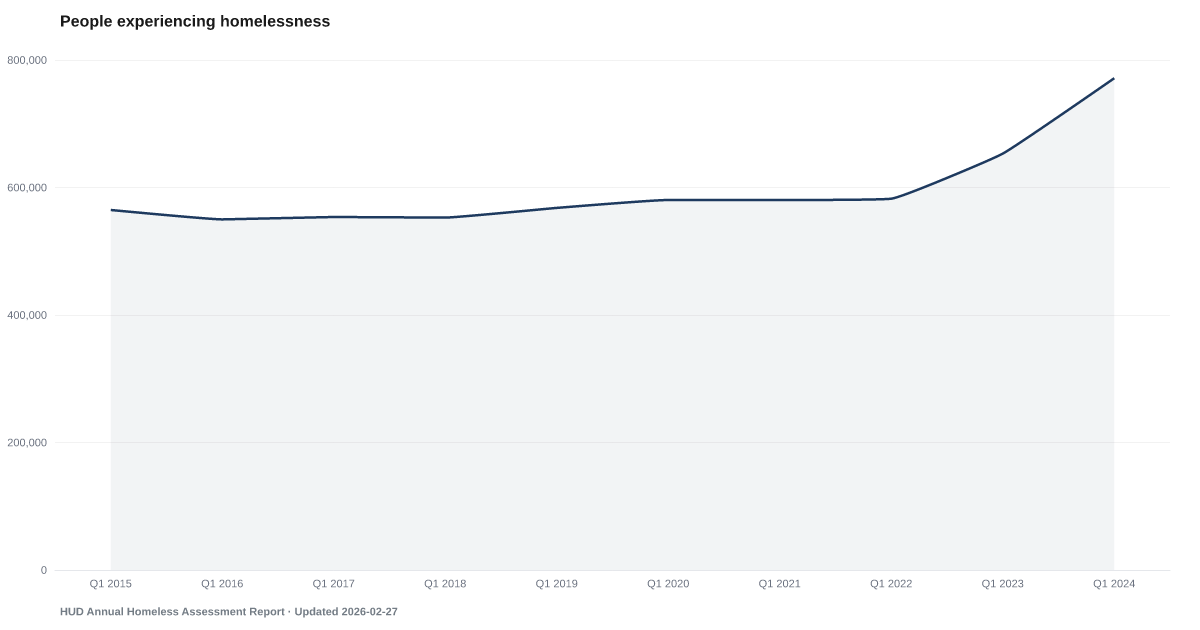
745,652 in 2025, down from 771,480 in 2024
What is the current Homelessness: HUD Point-in-Time Count reading?
On a single night in January 2025, local counters found 745,652 people staying in shelters or sleeping in places not meant for living, according to the U.S. Department of Housing and Urban Development's Annual Homeless Assessment Report. That is down from 771,480 in 2024. The one-night count leaves out people who are doubled up with others and misses people who are homeless at other times of the year.
HUD's point-in-time count found 745,652 people experiencing homelessness in January 2025, 25,828 fewer than a year earlier.
Each January, about 385 local Continuums of Care, the networks that run homeless services for a city, county or whole state, count the people staying in shelters and the people in unsheltered places on one night. HUD adds up their counts in Part 1 of its Annual Homeless Assessment Report. The 2025 total is 745,652, 3.3% below the 2024 count of 771,480. It is the lowest count since 2023.
The count covers people in emergency shelters, transitional housing and safe havens, and people sleeping in places not meant for living, such as cars, parks, abandoned buildings and bus stations. It leaves out people who are doubled up with friends or family, and formerly homeless people now living in permanent supportive housing. It counts people, not households, and it records no citizenship.
It is a count of one night, not of a year. Some Continuums of Care count everyone they can find; others count a sample and estimate the rest. When a Continuum skips its street count, HUD carries its earlier street count forward, and HUD says the unsheltered number could be larger than reported. Weather, local policy and counting methods can all change the number from one year to the next, so a change in the count is not by itself a change in how many people became homeless.
HUD's 2021 count is not a full national count: because of the pandemic, HUD let communities skip counting people sleeping outside that year. This page makes no comparison with 2021.
Explore Further
Is this happening to you?
Do you see more people experiencing homelessness in your community than you did a few years ago?
Homelessness: HUD Point-in-Time Count over time: what has changed?

Counties with the highest safety net and buffer scores
These are safety net and buffer scores from our County Distress Index, not county readings of Homelessness: HUD Point-in-Time Count.
Explore all 3,144 counties →| Period | Value | YoY Change |
|---|---|---|
| 2025 | 746K | -25K |
| 2024 | 771K | +118K |
| 2023 | 653K | +71K |
| 2022 | 582K | — |
| 2020 | 580K | +12K |
| 2019 | 568K | +15K |
| 2018 | 553K | +2K |
| 2017 | 551K | +1K |
| 2016 | 550K | -15K |
| 2015 | 565K | -11K |
| 2014 | 576K | -14K |
| 2013 | 590K | -32K |
Frequently Asked Questions
How many people are homeless in the U.S.?
HUD's latest national count, for one night in January 2025, is 745,652 people. More people are homeless at some point over a year than on any one night: HUD's shelter records show about 1.39 million people used an emergency shelter, transitional housing or a safe haven from October 2021 to September 2022, and that figure leaves out people who were only unsheltered.
Is homelessness going up?
HUD's 2025 count was 745,652, 3.3% lower than the 2024 count of 771,480. Some of any change can come from counting methods, weather and carried-forward street counts rather than from more or fewer people becoming homeless.
Who is left out of the count?
People who are doubled up or couch-surfing, people in permanent supportive housing or rapid rehousing, and people in housing not set aside for homeless people. The Education Department's larger count of homeless students uses a different definition that includes doubled-up families, so it is not the same measure.
Where does the homelessness count come from?
HUD's Annual Homeless Assessment Report, Part 1. Local Continuums of Care count people in shelters and in unsheltered places on one night in late January, and HUD publishes the national total with no fixed release date.


Quick poll
Is this affecting you or your household?
Discussion
Get the numbers when they move.
New data drops, indicator updates, and American Distress Index changes — delivered when it matters. No spam.
or Create an Account for full access
Loading comments…