Financially Healthy Households (Financial Health Network)
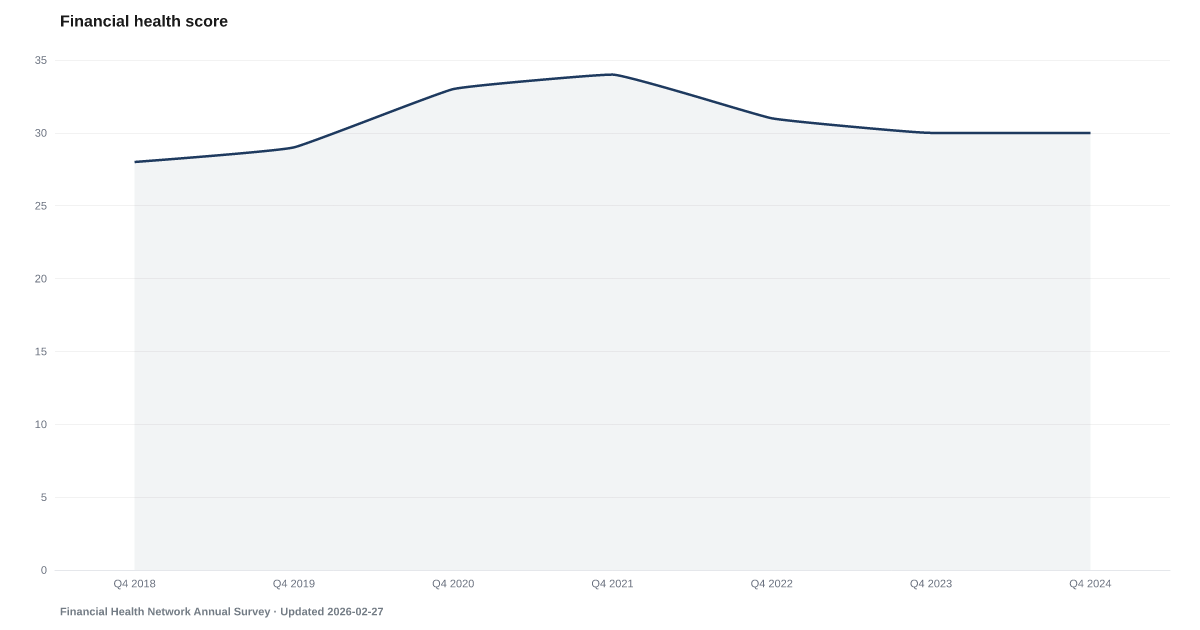
31% of households scored Financially Healthy, the same share as in 2025
What is the current Financially Healthy Households (Financial Health Network) reading?
In the Financial Health Network's spring 2026 Financial Health Pulse survey, 31% of U.S. households had a FinHealth Score of 80 or higher, the Financially Healthy tier. The share was the same in 2025. The rest scored as Coping or Vulnerable. Source: Financial Health Network, Financial Health Pulse U.S. Trends Report.
Measurement basis: Share of U.S. households (individuals before the 2023 survey) the Financial Health Network classifies as Financially Healthy on its FinHealth Score, which combines eight measures of spending, saving, borrowing and planning. The Pulse survey is fielded on the University of Southern California's Understanding America Study, a probability-based internet panel recruited by address-based sampling and weighted to population benchmarks for the U.S. population. Respondents are scored from their answers; they are not asked to rate their own financial health.
31% of U.S. households were Financially Healthy in the Financial Health Network's 2026 survey, the same share as in 2025.
The Financial Health Network's Financial Health Pulse survey scores each household from its answers to eight questions about spending, saving, borrowing and planning. A FinHealth Score of 80 to 100 counts as Financially Healthy, 40 to 79 as Coping, and 0 to 39 as Vulnerable. In the spring 2026 survey, 31% of households scored in the healthy tier.
Respondents are not asked to rate their own financial health. The questions ask, for example, whether spending stays within income, whether bills are paid on time, how long savings would last, whether debt feels manageable and which range their credit score is in. The network has no “poor” tier; the households outside the healthy tier are Coping or Vulnerable.
Through 2022 the survey sampled and weighted individuals. Starting with the 2023 survey it counts one respondent per household and weights to U.S. households. Shares before and after that switch describe different units, so this page compares only the household-level years.
The survey runs each spring on the University of Southern California's Understanding America Study, an internet panel recruited by mail from a random sample of addresses. The network publishes its report each autumn.
This survey adds a household-level view. The personal saving rate shows how much of their income households save, and a Bankrate survey reports the share who said they would use savings to pay a $1,000 emergency. They measure different things and are not combined.
Explore Further
Financially Healthy Households (Financial Health Network) over time: what has changed?

Counties with the highest safety net and buffer scores
These are safety net and buffer scores from our County Distress Index, not county readings of Financially Healthy Households (Financial Health Network).
Explore all 3,144 counties →| Period | Value | YoY Change |
|---|---|---|
| 2026 | 31% | 0 pp |
| 2025 | 31% | +1 pp |
| 2024 | 30% | -1 pp |
| 2023 | 31% | — |
| 2022 | 31% | -3 pp |
| 2021 | 34% | +2 pp |
| 2020 | 32% | +3 pp |
| 2019 | 29% | +1 pp |
| 2018 | 28% | — |
How to read this series
The source changed how it measures this in 2023. The Financial Health Network sampled and weighted at the individual level through 2022 and at the household level from 2023, sampling one self-identified financial decision-maker per household. Readings on either side of this boundary describe different units. Readings on either side are not directly comparable, so the year-over-year column stays blank where a comparison would cross that date. Source documentation.
Frequently Asked Questions
What share of U.S. households are financially healthy?
The Financial Health Network put it at 31% in its 2026 survey. It was the same in 2025. Households below the healthy tier score as Coping or Vulnerable.
What does the FinHealth Score measure?
It averages points from eight survey answers across four areas: spend, save, borrow, and plan. The score runs from 0 to 100, and this page shows the share of households scoring 80 or more.
Can the latest share be compared with 2021?
Not directly. Readings through 2022 are shares of individuals; readings from 2023 on are shares of households, with one respondent per household. The network marks the change on its own charts.
Where does this data come from?
The Financial Health Network's annual Financial Health Pulse survey, fielded each spring on the University of Southern California's Understanding America Study and published each autumn.


Quick poll
Is this affecting you or your household?
Discussion
Get the numbers when they move.
New data drops, indicator updates, and American Distress Index changes — delivered when it matters. No spam.
or Create an Account for full access
Loading comments…