Unbanked / Underbanked Household Rate
Down from 4.5% two years ago; a record low, halved from 8.2% in 2011
What is the current Unbanked / Underbanked Household Rate?
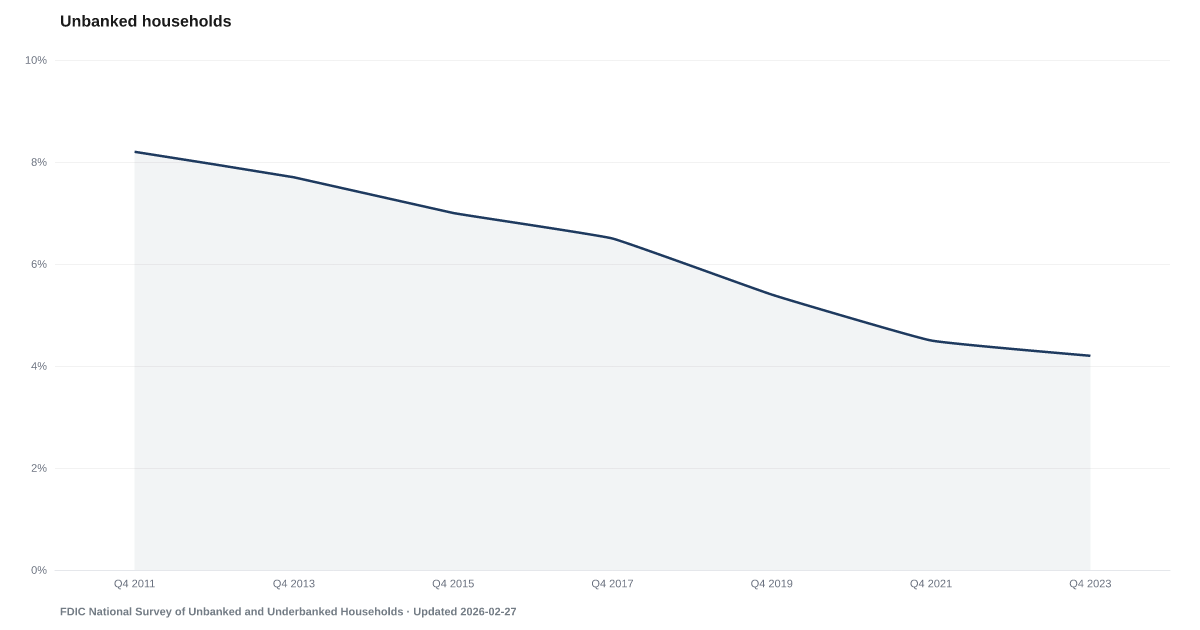
Unbanked / Underbanked Household Rate: 4.2% as of 2023, and improving. Source: FDIC National Survey of Unbanked and Underbanked Households.
The share of U.S. households without a bank account has fallen to 4.2%. The current reading is the lowest in the site series.
The FDIC's National Survey of Unbanked and Underbanked Households, conducted every two years, measured the unbanked rate at 4.2% in 2023. That is down from 8.2% in 2011 — a halving over a dozen years. The trend is one of the cleaner pieces of good news in American household finance.
Having a bank account matters. Without one, routine life runs through check cashers, prepaid cards, and payday lenders — each skimming fees that a checking account would absorb for free. The FDIC estimates unbanked households pay hundreds of dollars a year in fees for services a bank would provide at no cost.
The improvement is real. It is also partial. A bank account is the entry point of financial participation, not the ceiling. Millions of households now have accounts but still rely on alternative financial services for credit — the underbanked layer that this survey tracks separately.
Access to a checking account does not replace savings. The Safety Net shows that a minority of Americans could cover a $1,000 emergency from savings. The Buffer — the personal savings rate — sits near historic lows. The banking system has opened its doors wider than ever. What is sitting inside those accounts is thinner than ever.
Explore Further
Is this happening to you?
Do you or someone you know rely on check-cashing or prepaid cards instead of a bank account?
How has Unbanked / Underbanked Household Rate changed over time?

Most affected counties
Counties with the highest safety net and buffer scores in the County Distress Index.
Explore all 3,144 counties →| Period | Value | YoY Change |
|---|---|---|
| Dec 2023 | 4.2% | — |
| Dec 2021 | 4.5% | — |
| Dec 2019 | 5.4% | — |
| Dec 2017 | 6.5% | — |
| Dec 2015 | 7% | — |
| Dec 2013 | 7.7% | — |
| Dec 2011 | 8.2% | — |
Frequently Asked Questions
What is Unbanked / Underbanked Household Rate?
Down from 4.5% two years ago; a record low, halved from 8.2% in 2011
Why does Unbanked / Underbanked Household Rate matter for financial distress?
Unbanked / Underbanked Household Rate is one of the indicators tracked by the American Distress Index (ADI), which measures five dimensions of U.S. household financial distress: Delinquency, Default & Legal, Debt Burden, Labor, and Safety Net & Buffer. Changes in this indicator contribute to the overall distress picture.
Where does the Unbanked / Underbanked Household Rate data come from?
This data comes from FDIC National Survey of Unbanked and Underbanked Households. More information: https://www.fdic.gov/analysis/household-survey/. The American Distress Index updates this indicator biennial.

Quick poll
Is this affecting you or your household?
Discussion
Get the numbers when they move.
New data drops, indicator updates, and ADI score changes — delivered when it matters. No spam.
or Create an Account for full access
Loading comments…