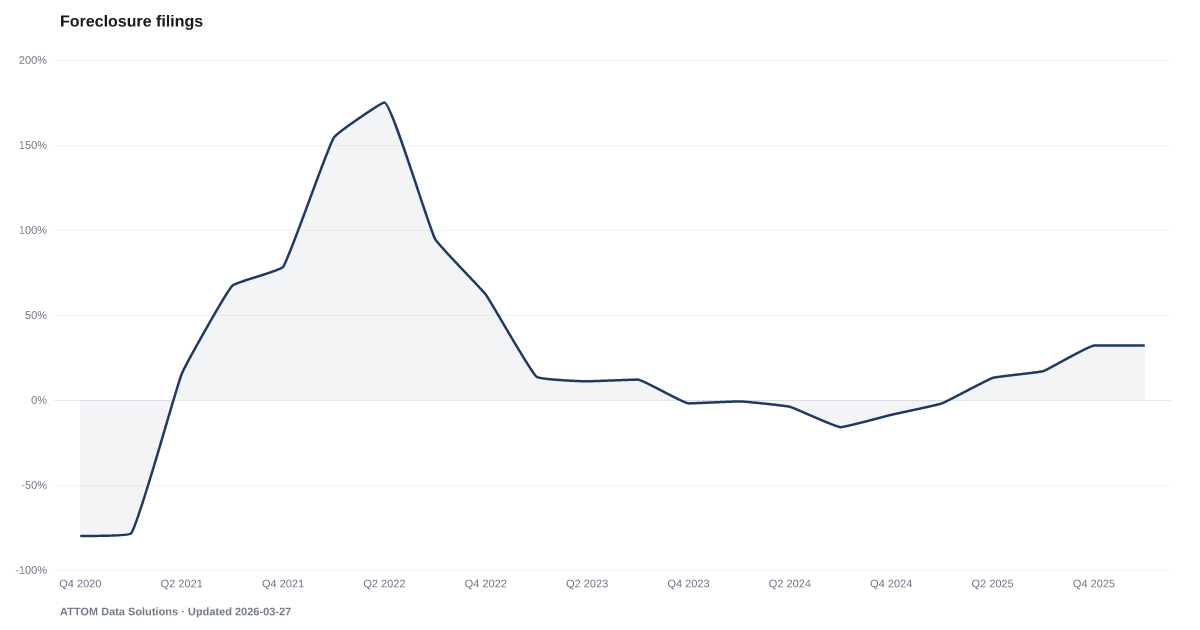
Foreclosure Filings YoY Change
Change from a year earlier in U.S. properties with a foreclosure filing
What is the current Foreclosure Filings YoY Change reading?
The number of U.S. properties with a foreclosure filing in Q2 2026 was 15% higher than a year earlier, up from a year-over-year change of 13% in Q2 2025, according to ATTOM Data Solutions. A filing is a default notice, a scheduled auction or a bank repossession, and each property counts once per quarter. Source: ATTOM Data Solutions quarterly U.S. foreclosure market report.
ATTOM's count of U.S. properties with a foreclosure filing was 15% higher than a year earlier in Q2 2026.
ATTOM Data Solutions, a private property-data company, counts U.S. properties with at least one foreclosure document entered in its database during the quarter: a default notice, a scheduled auction or a bank repossession. In Q2 2026 that count was 15% higher than a year earlier, up from a year-over-year change of 13% in Q2 2025. No quarter between Q2 2025 and this one had a lower year-over-year change.
This page tracks the year-over-year change, not the count itself. A change above zero means more properties had a filing than in the same quarter a year before, even when it is smaller than an earlier quarter's change; a change below zero means fewer. It does not show the change from the previous quarter. ATTOM does not seasonally adjust its counts, meaning it leaves in regular calendar patterns, so quarter-to-quarter moves in the counts are not read as a trend here. ATTOM publishes the change as a whole percent, and so does this page.
A property is counted once a quarter however many documents are filed on it, and it is not counted again for a repeat of the same document within its state's usual foreclosure timeframe. The count covers properties, not borrowers or loans, and most properties with a filing have not been foreclosed on: completed foreclosures are a separate ATTOM count. ATTOM collects filings from counties covering more than 99 percent of the U.S. population, and it counts each filing by the date it enters its database, so some were recorded in the quarter before.
Foreclosure filings, mortgage delinquencies and completed foreclosures are separate measures. FHA mortgage delinquency reports late payments on FHA loans, and foreclosure starts vs. repossessions compares ATTOM's monthly foreclosure starts with its bank repossessions. None of them, alone, shows how many cases will end in a completed foreclosure, and none shows why a payment was missed.
Explore Further
Is this happening to you?
Have you received any notices from your mortgage servicer that worried you?
Foreclosure Filings YoY Change over time: what has changed?

Counties with the highest default and legal scores
These are default and legal scores from our County Distress Index, not county readings of Foreclosure Filings YoY Change.
Explore all 3,144 counties →| Period | Value | YoY Change |
|---|---|---|
| Q2 2026 | 15% | +2 pp |
| Q1 2026 | 26% | +28 pp |
| Q4 2025 | 32% | +41 pp |
| Q3 2025 | 17% | +30 pp |
| Q2 2025 | 13% | +21 pp |
| Q1 2025 | -2% | -2 pp |
| Q4 2024 | -9% | -11 pp |
| Q3 2024 | -13% | -22 pp |
| Q2 2024 | -8% | -16 pp |
| Q1 2024 | 0% | -22 pp |
| Q4 2023 | 2% | -59 pp |
| Q3 2023 | 9% | -95 pp |
Frequently Asked Questions
How have foreclosure filings changed from a year ago?
In Q2 2026, the number of U.S. properties with a foreclosure filing was 15% higher than a year earlier, by ATTOM's count. That change is up from 13% in Q2 2025. The figure counts properties, not homes lost: most had a default notice or auction notice, not a completed foreclosure.
Is this the foreclosure rate?
No. The foreclosure rate ATTOM publishes is filings per housing unit. This indicator is the change in the count of properties with a filing from the same quarter a year earlier.
Does this count completed foreclosures?
Only in part. A property is counted if it had a document from any of three stages in the quarter: a default notice, a scheduled auction or a bank repossession. Completed foreclosures, where the lender takes the property back, are one of those stages, and ATTOM reports them separately.
Where does foreclosure filing data come from?
ATTOM Data Solutions collects publicly recorded and published foreclosure documents from U.S. counties. It publishes the quarterly national figure two to three weeks after each quarter ends, in its quarterly, mid-year and year-end foreclosure reports, with no fixed release calendar.


Quick poll
Is this affecting you or your household?
Discussion
Get the numbers when they move.
New data drops, indicator updates, and American Distress Index changes — delivered when it matters. No spam.
or Create an Account for full access
Loading comments…