The Wipeout Ratio
Ratio of Chapter 7 liquidation to Chapter 13 reorganization filings
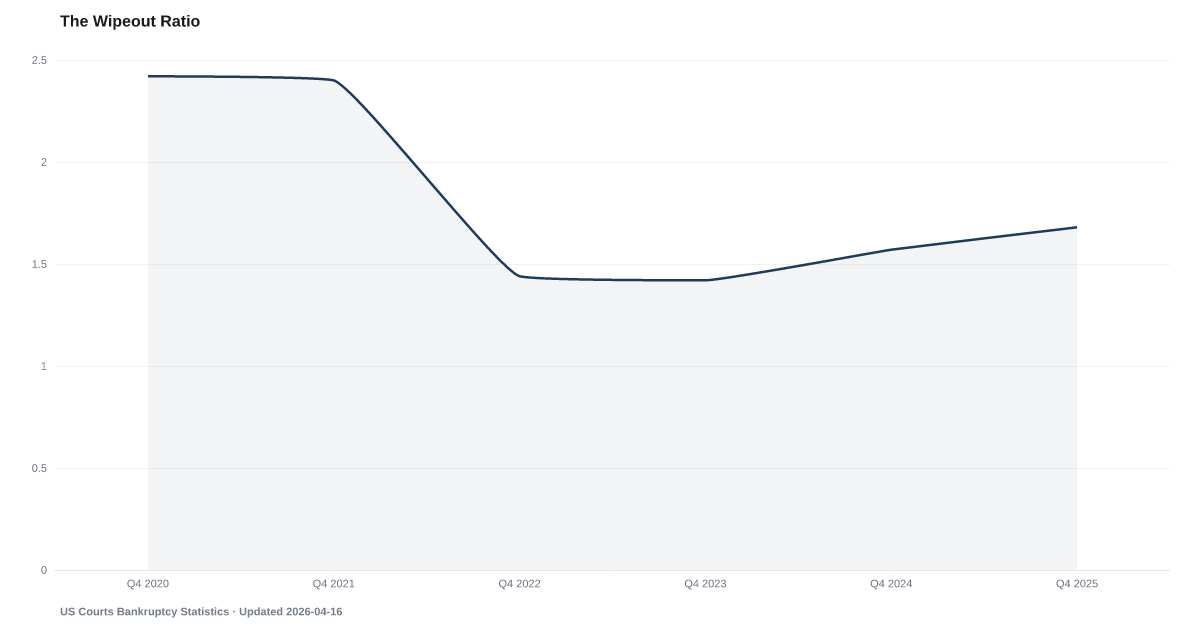
What is the current The Wipeout Ratio?
The ratio of Chapter 7 liquidation to Chapter 13 reorganization filings reached 1.8 in Q1 2026, up from 1.42 in 2023, according to U.S. Courts data. Chapter 7 means surrendering non-exempt assets to discharge unsecured debt; Chapter 13 means proposing a 3–5 year repayment plan. A rising ratio indicates that more filers lack the income to sustain a repayment plan — a deeper signal of household distress than headline filing volume alone. Source: U.S. Courts.
The shift toward total liquidation in bankruptcy signals that more families have crossed the line from struggling to starting over.
The ratio of Chapter 7 liquidation filings to Chapter 13 reorganization filings rose to 1.8 in Q1 2026, up from 1.42 in 2023 and 1.57 in 2024, according to U.S. Courts bankruptcy statistics. In Chapter 13, filers propose a 3–5 year repayment plan and keep their assets. In Chapter 7, they surrender non-exempt assets and discharge their debts entirely. A rising ratio means more Americans are concluding that no repayment plan can work.
The distinction matters because it reveals the depth of financial distress. Chapter 13 requires sufficient income to make plan payments — when the ratio shifts toward Chapter 7, it indicates that filers' income can no longer cover even a reduced payment schedule. Bankruptcy Filings overall are running higher year-over-year, but the shift within that total toward liquidation suggests the typical filer is in worse financial condition than in previous quarters.
The pattern connects directly to the buffer indicators. The Safety Net shows emergency savings under pressure, and Foreclosure Filings have risen sharply year-over-year. When savings are gone, debts are unmanageable, and home equity is insufficient, Chapter 7 becomes the only option that remains.
Explore Further
Is this happening to you?
If you had to file bankruptcy, would you want to keep your assets or start fresh?
How has The Wipeout Ratio changed over time?

Most affected counties
Counties with the highest default and legal scores in the County Distress Index.
Explore all 3,144 counties →| Period | Value | YoY Change |
|---|---|---|
| Q1 2026 | 1.75 | +0.14 |
| Q4 2025 | 1.72 | +0.15 |
| Q3 2025 | 1.7 | +0.18 |
| Q2 2025 | 1.66 | +0.18 |
| Q1 2025 | 1.61 | +0.16 |
| Q4 2024 | 1.57 | +0.15 |
| Q3 2024 | 1.52 | +0.12 |
| Q2 2024 | 1.48 | +0.10 |
| Q1 2024 | 1.45 | — |
| Q4 2023 | 1.42 | — |
| Q3 2023 | 1.4 | — |
| Q2 2023 | 1.38 | — |
Frequently Asked Questions
What is the Chapter 7 to Chapter 13 bankruptcy ratio?
The ratio was 1.8 in Q1 2026, meaning for every family attempting a 3–5 year repayment plan under Chapter 13, more than one and a half families chose total liquidation under Chapter 7. The ratio has risen from 1.42 in 2023.
What is the difference between Chapter 7 and Chapter 13 bankruptcy?
In Chapter 7, filers surrender non-exempt assets and discharge nearly all qualifying debts. In Chapter 13, filers propose a 3–5 year repayment plan and keep their assets. Chapter 7 is chosen when income is too low to support a repayment plan.
Why is a rising ratio significant?
A rising ratio toward Chapter 7 indicates deepening financial distress. Chapter 13 requires sufficient income to make plan payments. When the ratio shifts, it means more filers have income so low or debts so large that no repayment plan would work.
What does the wipeout ratio predict?
The wipeout ratio reflects the severity of distress among those already in bankruptcy. Combined with a rising total filing volume, the ratio suggests that more households are facing not just financial trouble but financial failure.
Where does the Chapter 7 vs. Chapter 13 data come from?
U.S. Courts publishes bankruptcy filing statistics broken down by chapter type. American Default Research computes the ratio by dividing total Chapter 7 consumer filings by total Chapter 13 consumer filings on an annual basis.

Quick poll
Is this affecting you or your household?
Discussion
Get the numbers when they move.
New data drops, indicator updates, and ADI score changes — delivered when it matters. No spam.
or Create an Account for full access
Loading comments…