Credit Card Delinquency Gap: Smaller Banks vs. the 100 Largest
Difference between two Federal Reserve commercial-bank credit card delinquency rates
What is the current Credit Card Delinquency Gap: Smaller Banks vs. the 100 Largest reading?
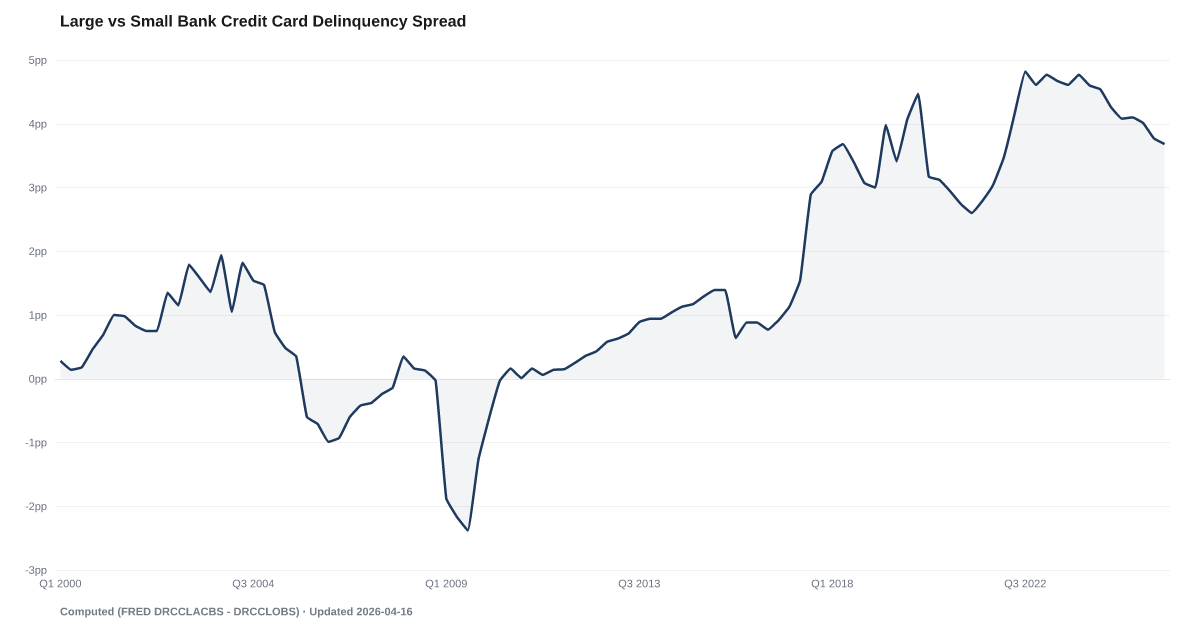
In Q2 2026 the credit card delinquency rate at commercial banks outside the 100 largest was 3.8 percentage points higher than the rate at the 100 largest, down from 4.1 percentage points a year earlier. The gap is the Board of Governors of the Federal Reserve System's seasonally adjusted rate for all other commercial banks minus its rate for the 100 largest, in the same quarter. It does not explain the difference. Source: Federal Reserve Board data retrieved via FRED.
Measurement basis: Seasonally adjusted, end-of-quarter delinquency rate on credit card loans at commercial banks outside the 100 largest by assets minus the corresponding rate at banks ranked 1st through 100th, in percentage points. Both rates are taken from the same Federal Reserve Board release, the same realtime vintage, before one is subtracted from the other.
Card delinquency at banks outside the 100 largest was 3.8 percentage points higher than at the 100 largest in Q2 2026, down from 4.1 percentage points a year earlier.
The Federal Reserve Board publishes one credit card delinquency rate for the 100 largest commercial banks and another for all the others. In Q2 2026 the rate outside the 100 largest was 3.8 percentage points higher than the rate at the 100 largest, little changed from 3.6 percentage points in Q1 2026. A year earlier the gap was 4.1 percentage points.
The Board re-estimates past values of both rates at almost every release, so the gap's history, including the newest quarter, can change.
Both rates count card balances 30 or more days past due or in nonaccrual status, as a share of card balances at that group of banks. They count dollars, not borrowers or accounts. The gap is a difference in percentage points, not a percent change.
The two groups are very different in size. In the first quarter of 2026, banks outside the 100 largest held about 3 percent of commercial-bank card balances, so the all-bank rate mostly reflects the 100 largest. The outside group is set by asset rank, not by a list of community banks, and its members change as banks grow, shrink or merge. The gap does not say why the two rates differ.
Comparisons on this page start in 2010. That quarter an accounting change brought securitized card loans onto a few large banks' books, so earlier gaps are not on the same basis. Readings before 2001 also rest partly on Board estimates for smaller banks. A separate page tracks the outside-top-100 rate on its own, and Credit Card Delinquency tracks the rate at all commercial banks.
Explore Further
Is this happening to you?
Do you carry a balance on a card from a smaller bank?
Credit Card Delinquency Gap: Smaller Banks vs. the 100 Largest over time: what has changed?

Counties with the highest delinquency scores
These are delinquency scores from our County Distress Index, not county readings of Credit Card Delinquency Gap: Smaller Banks vs. the 100 Largest.
Explore all 3,144 counties →| Period | Value | YoY Change |
|---|---|---|
| Q2 2026 | 3.8 pp | -0.3 pp |
| Q1 2026 | 3.6 pp | -0.7 pp |
| Q4 2025 | 3.8 pp | -0.4 pp |
| Q3 2025 | 3.9 pp | -0.5 pp |
| Q2 2025 | 4.1 pp | -0.6 pp |
| Q1 2025 | 4.3 pp | -0.5 pp |
| Q4 2024 | 4.2 pp | -0.7 pp |
| Q3 2024 | 4.4 pp | -0.3 pp |
| Q2 2024 | 4.7 pp | -0.1 pp |
| Q1 2024 | 4.8 pp | -0.1 pp |
| Q4 2023 | 4.9 pp | +0.1 pp |
| Q3 2023 | 4.7 pp | -0.3 pp |
How to read this series
The source changed how it measures this in Q1 2010. From the first quarter of 2010, credit card rates cover loans that banks had securitized and previously kept off their balance sheets. Accounting standards FAS 166 and 167 required banks to bring those loans back on, and the Board states the change is reflected in the 2010-Q1 Call Reports; one large credit card bank made the move in the fourth quarter of 2009. The Board's H.8 notes put the credit card and other revolving loans consolidated by domestically chartered commercial banks at about $335 billion as of March 31, 2010. Rates from 2010 on are measured over a different pool of loans than earlier readings. Readings on either side are not directly comparable, so the year-over-year column stays blank where a comparison would cross that date. Source documentation.
Frequently Asked Questions
What is the credit card delinquency gap between smaller and largest banks?
In Q2 2026 the credit card delinquency rate at commercial banks outside the 100 largest was 3.8 percentage points higher than the rate at the 100 largest, down from 4.1 percentage points a year earlier. The gap is the Federal Reserve Board's seasonally adjusted rate for all other commercial banks minus its rate for the 100 largest, in the same quarter. It does not explain the difference. Source: Federal Reserve Board data retrieved via FRED.
How should the gap's sign be read?
A positive gap means the delinquency rate on card balances at banks outside the 100 largest was higher in that quarter. A negative gap means the rate at the 100 largest was higher. The size is the difference in percentage points, not a percent change.
Where does this data come from?
The Federal Reserve Board compiles both seasonally adjusted quarterly rates from bank Call Reports in its Charge-Off and Delinquency Rates on Loans and Leases at Commercial Banks release. FRED republishes them as DRCCLOBS and DRCCLT100S. The Board publishes no gap; we subtract the two.
Does the gap identify borrowers or causes?
No. It is arithmetic on two rates built from bank balances. It does not describe customers, credit scores, lending strategy or why the rates differ.


Quick poll
Is this affecting you or your household?
Discussion
Get the numbers when they move.
New data drops, indicator updates, and American Distress Index changes — delivered when it matters. No spam.
or Create an Account for full access
Loading comments…