Long-Term Unemployed Share (27+ Weeks)
Also tracked as The Long Haul
Long-term unemployed as a share of the unemployed
What is the current Long-Term Unemployed Share (27+ Weeks) reading?
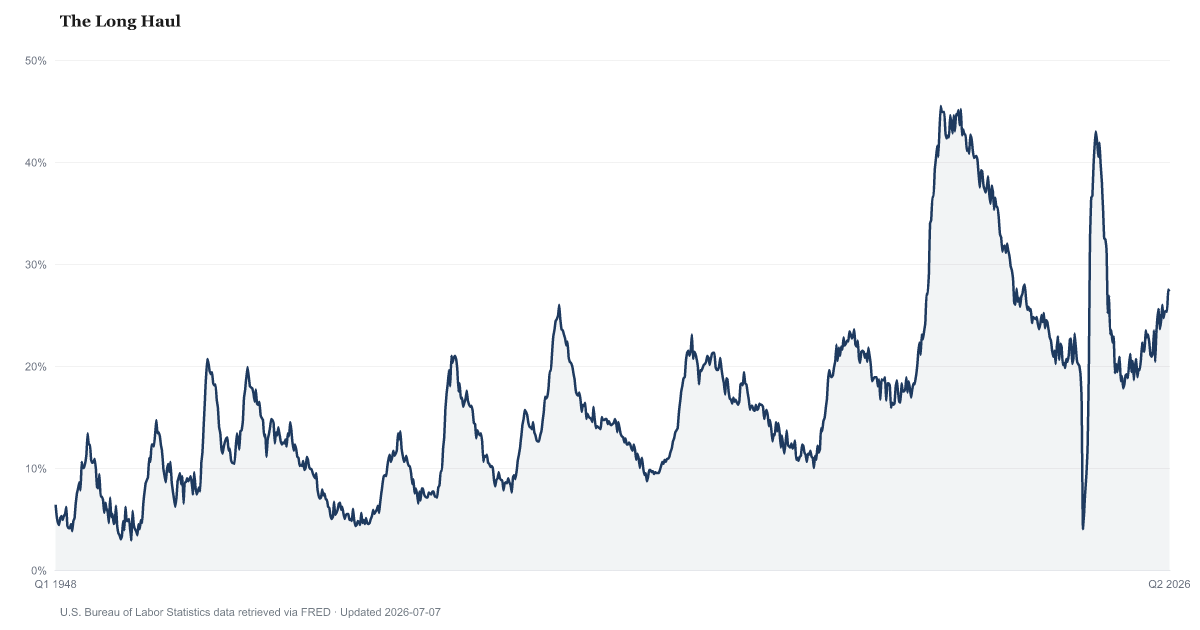
The long-term unemployed share was 27% in August 2026, little changed from 25.6% a year earlier, according to the U.S. Bureau of Labor Statistics. It is the percent of unemployed people whose current search for work has lasted 27 weeks or more. It is a share of the unemployed, not of all workers. Source: BLS Current Population Survey (LNS13025703).
Of everyone unemployed in August 2026, 27% had been looking for work for 27 weeks or longer, little changed from 25.6% a year earlier.
A month earlier, in July 2026, the share was 25.5%, little changed.
Someone is unemployed in this survey if they had no job in the survey week, were available to work, and looked for work in the past four weeks, or were waiting to be recalled from a temporary layoff. Duration counts the weeks of the current spell of looking, so it measures spells still under way, not how long it takes to find a job. People who want a job but have stopped looking are outside the count, and receiving unemployment benefits plays no part in it.
The share is seasonally adjusted, which removes the usual swings of the calendar. It rests on a sample of the unemployed, a small group in the survey, so it is noisy from month to month. By our estimate a one-month change needs to exceed about 2 percentage points (points on the percent scale, not a percent of the share) to stand out from sampling error. Smaller moves are described here as little changed. BLS also revises the last five years of seasonally adjusted values each January, and those revisions have changed a month's value by up to 2 points.
Comparisons on this page start in 1994. That January BLS redesigned the survey questionnaire, and its researchers found the change affected how long people reported being unemployed. The survey did not run in October 2025, during the federal government shutdown. In November 2025 every jobseeker was asked their duration afresh rather than having it carried forward, so the September-to-November move spans two months and a change in method.
The Unemployment Rate says how many people are looking for work; this share says how many of them have been looking for six months or more. Continued Unemployment Claims counts people collecting benefits, a different group from a different source, and U-6 Underemployment adds people the headline rate leaves out.
Long-Term Unemployed Share (27+ Weeks) over time: what has changed?

Counties with the highest labor scores
These are labor scores from our County Distress Index, not county readings of Long-Term Unemployed Share (27+ Weeks).
Explore all 3,144 counties →| Period | Value | YoY Change |
|---|---|---|
| Aug 2026 | 27% | +1.4 pp |
| Jul 2026 | 25.5% | +0.6 pp |
| Jun 2026 | 27.3% | +4 pp |
| May 2026 | 27.5% | +7.1 pp |
| Apr 2026 | 25.3% | +1.8 pp |
| Mar 2026 | 25.4% | +4.1 pp |
| Feb 2026 | 25.3% | +4.4 pp |
| Jan 2026 | 24.7% | +3.6 pp |
| Dec 2025 | 26% | +3.7 pp |
| Nov 2025 | 24.4% | +1.3 pp |
| Sep 2025 | 23.6% | +0.1 pp |
| Aug 2025 | 25.6% | +4.2 pp |
How to read this series
The source changed how it measures this in Jan 1994. BLS redesigned the Current Population Survey questionnaire and collection methods in January 1994, and BLS researchers found the redesign affected duration-of-unemployment statistics, so earlier values are not directly comparable. Readings on either side are not directly comparable, so the year-over-year column stays blank where a comparison would cross that date. Source documentation.
Frequently Asked Questions
What share of the unemployed are long-term unemployed?
BLS's latest figure, for August 2026, is 27%. That is little changed from a year earlier, when it was 25.6%. BLS counts someone as long-term unemployed once their current spell reaches 27 weeks, about six months.
Is this the long-term unemployment rate?
No. This is a share of unemployed people. Figures published elsewhere as a 'long-term unemployment rate' are a different ratio, not a share of the unemployed, and the two should not be mixed. BLS's U-1 measure is different again: it uses a 15-week cutoff and divides by the labor force.
Have the long-term unemployed given up looking for work?
No. To be counted as unemployed a person must have looked for work in the past four weeks, or be on temporary layoff. People who want a job but stopped looking are outside the labor force and outside this share.
Where does this data come from?
BLS estimates it each month from the Current Population Survey, a survey of about 60,000 households that the Census Bureau runs for BLS, and publishes it in table A-12 of the Employment Situation report.

Quick poll
Is this affecting you or your household?
Discussion
Get the numbers when they move.
New data drops, indicator updates, and American Distress Index changes — delivered when it matters. No spam.
or Create an Account for full access
Loading comments…