U-6 Underemployment Rate
Broadest measure of labor underutilization
Historically follows Initial Unemployment Claims (SA) by 1 quarter — no active signal. Initial Unemployment Claims (SA) · View projections
What is the current U-6 Underemployment Rate?
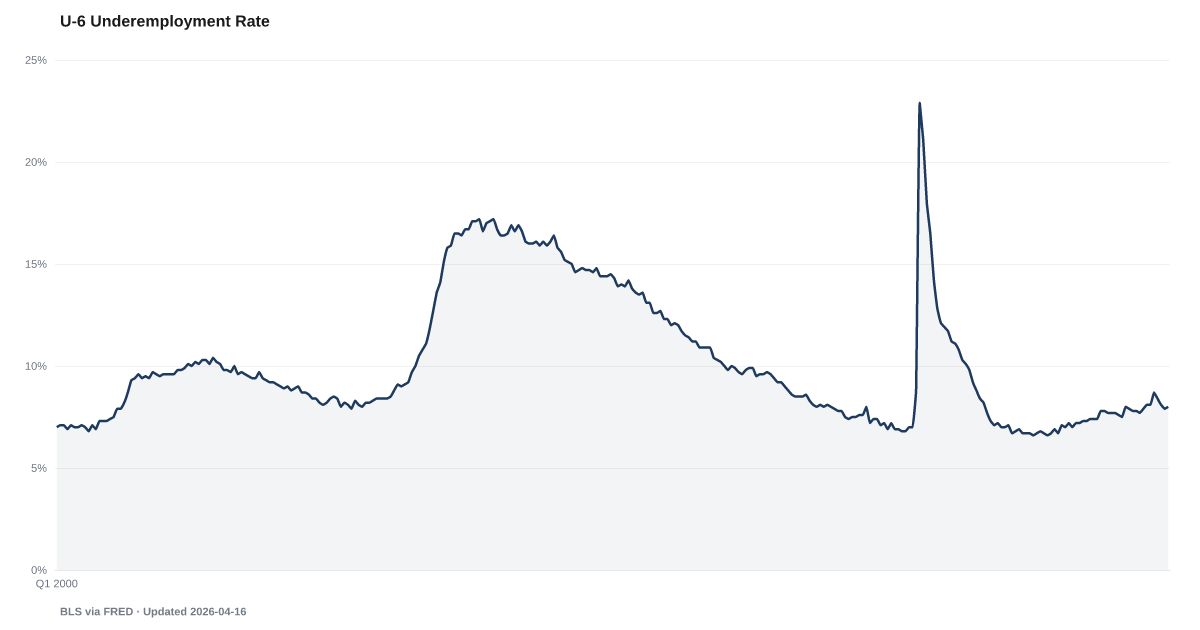
U-6 Underemployment Rate: 8.1% as of 2026-05, and worsening. Source: BLS via FRED.
The broader measure of U.S. labor-market slack stands at 8.1% — far above the headline unemployment rate — and captures the part-time, marginally attached, and discouraged workers the official figure leaves out.
The BLS publishes six different measures of unemployment, labeled U-1 through U-6. The headline Unemployment Rate, U-3, counts only those who are actively looking for work. The broadest measure, U-6, adds workers who want a job but haven't searched recently, workers only marginally attached to the labor force, and workers part-time for economic reasons. The May 2026 reading is 8.1%.
The gap between U-3 and U-6 is a rough index of hidden slack. The current spread sits well above the 2022 reading of roughly 3.1 points and well below the 2009 crisis gap that exceeded 7 points. That gap rises when underemployment climbs faster than unemployment, which is what American Worker Index-adjacent labor distress typically looks like in its early stages.
U-6 leads U-3 modestly when the labor market turns, because underemployment builds before outright job loss. Initial Unemployment Claims validates 1 quarter with r = 0.72 into U-6 itself across two prior crises — meaning when first-time filings rise, underemployment follows.
For households, U-6 is often the more honest number. A worker who has stopped looking because the market is dead or who is stuck in 25 hours a week isn't counted in the headline figure. They are counted here. If the question is how many Americans are not getting the work they need, 8.1% is closer to the truth than the headline U-3 print.
Explore Further
How has U-6 Underemployment Rate changed over time?

Most affected counties
Counties with the highest labor scores in the County Distress Index.
Explore all 3,144 counties →| Period | Value | YoY Change |
|---|---|---|
| May 2026 | 8.1% | +0.3 pts |
| Apr 2026 | 8.2% | +0.4 pts |
| Mar 2026 | 8% | +0.1 pts |
| Feb 2026 | 7.9% | −0.1 pts |
| Jan 2026 | 8.1% | +0.6 pts |
| Dec 2025 | 8.4% | +0.8 pts |
| Nov 2025 | 8.7% | +1.0 pts |
| Sep 2025 | 8.1% | +0.4 pts |
| Aug 2025 | 8.1% | +0.3 pts |
| Jul 2025 | 7.9% | +0.1 pts |
| Jun 2025 | 7.7% | +0.3 pts |
| May 2025 | 7.8% | +0.4 pts |
Frequently Asked Questions
What is U-6 Underemployment Rate?
Broadest measure of labor underutilization
Why does U-6 Underemployment Rate matter for financial distress?
U-6 Underemployment Rate is one of the indicators tracked by the American Distress Index (ADI), which measures five dimensions of U.S. household financial distress: Delinquency, Default & Legal, Debt Burden, Labor, and Safety Net & Buffer. Changes in this indicator contribute to the overall distress picture.
Where does the U-6 Underemployment Rate data come from?
This data comes from BLS via FRED. More information: https://fred.stlouisfed.org/series/U6RATE. The American Distress Index updates this indicator monthly.

Quick poll
Is this affecting you or your household?
Discussion
Get the numbers when they move.
New data drops, indicator updates, and ADI score changes — delivered when it matters. No spam.
or Create an Account for full access
Loading comments…