Unemployment Rate
Share of the labor force that is unemployed
Historically follows Initial Unemployment Claims (SA) by 1 quarter — no active signal. Initial Unemployment Claims (SA) · View projections
What is the current Unemployment Rate?
The U.S. unemployment rate (U-3) measures the share of the labor force that is actively seeking work but cannot find it. As the headline employment statistic, it is the most widely watched measure of labor market health, though it understates true labor market slack by excluding discouraged workers and involuntary part-time workers. Source: Bureau of Labor Statistics, Current Population Survey.
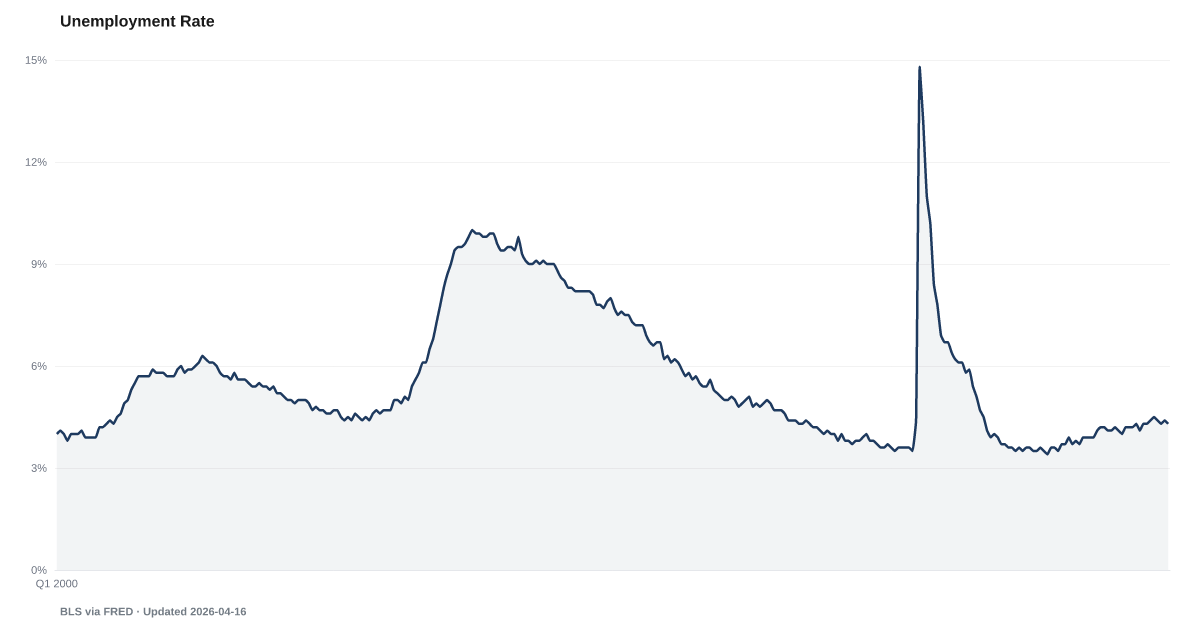
The headline U.S. unemployment rate sits at 4.3% — nearly a full point above its April 2023 low of 3.4% — a quiet, steady drift that has now been underway for years.
The BLS reports U.S. unemployment at 4.3% in May 2026. The rate bottomed at 3.4% in April 2023. It has drifted upward ever since, without the dramatic moves that mark recessions. One-tenth up here, holding flat there, one-tenth up again. A quiet, steady softening that the monthly headline reads as noise.
Recessions usually arrive fast. The unemployment rate rose 11 percentage points in two months during the 2020 shutdown and 5.6 points over two years and six months during the 2007-2009 Great Financial Crisis. A drift of well under two points over multiple years does not fit that template. What it fits is a structural pattern: hiring has slowed, the JOLTS Quits Rate has fallen into the low end of its post-2015 range, Continued Unemployment Claims have drifted higher as workers who do lose jobs take longer to find new ones. The level looks fine; the direction is the worry.
The U-3 rate also hides distress that shows up elsewhere. U-6 Underemployment runs far above the headline rate. Youth Unemployment sits well above the headline, in the age group where early automation exposure is greatest. Part-Time for Economic Reasons has climbed substantially from its 2022 low.
One additional framing worth keeping in mind: the Sahm rule triggers a recession signal when the three-month average unemployment rate rises 0.5 points above its 12-month low. That threshold has already been crossed in this cycle and then pulled back. Whether the current reading is the plateau before the next leg up, or the plateau that holds, depends on indicators that move faster than the unemployment rate itself — initial claims, announced layoffs, and the job-posting index.
Explore Further
How has Unemployment Rate changed over time?

Most affected counties
Counties with the highest labor scores in the County Distress Index.
Explore all 3,144 counties →| Period | Value | YoY Change |
|---|---|---|
| May 2026 | 4.3% | +0.0 pts |
| Apr 2026 | 4.3% | +0.1 pts |
| Mar 2026 | 4.3% | +0.1 pts |
| Feb 2026 | 4.4% | +0.2 pts |
| Jan 2026 | 4.3% | +0.3 pts |
| Dec 2025 | 4.4% | +0.3 pts |
| Nov 2025 | 4.5% | +0.3 pts |
| Sep 2025 | 4.4% | +0.3 pts |
| Aug 2025 | 4.3% | +0.1 pts |
| Jul 2025 | 4.3% | +0.1 pts |
| Jun 2025 | 4.1% | +0.0 pts |
| May 2025 | 4.3% | +0.4 pts |
Frequently Asked Questions
What is the current U.S. unemployment rate?
The U.S. unemployment rate (U-3) is published monthly by the Bureau of Labor Statistics. It measures the share of the civilian labor force that is jobless and actively seeking employment. Check the American Default indicator page for the latest reading.
Why does the unemployment rate understate labor market weakness?
The U-3 rate only counts people actively looking for work. It excludes discouraged workers who have stopped searching and people working part-time who want full-time hours. The broader U-6 measure, which includes these groups, is typically 3–4.3% higher.
Where does unemployment data come from?
The Bureau of Labor Statistics publishes the unemployment rate monthly based on the Current Population Survey (CPS), a monthly survey of approximately 60,000 households. The data is released on the first Friday of each month.

Quick poll
Is this affecting you or your household?
Discussion
Get the numbers when they move.
New data drops, indicator updates, and ADI score changes — delivered when it matters. No spam.
or Create an Account for full access
Loading comments…