Prime-Age Employment Rate (25-54)
Also tracked as The Prime Years
Prime-age employment rate (25-54)
What is the current Prime-Age Employment Rate (25-54) reading?
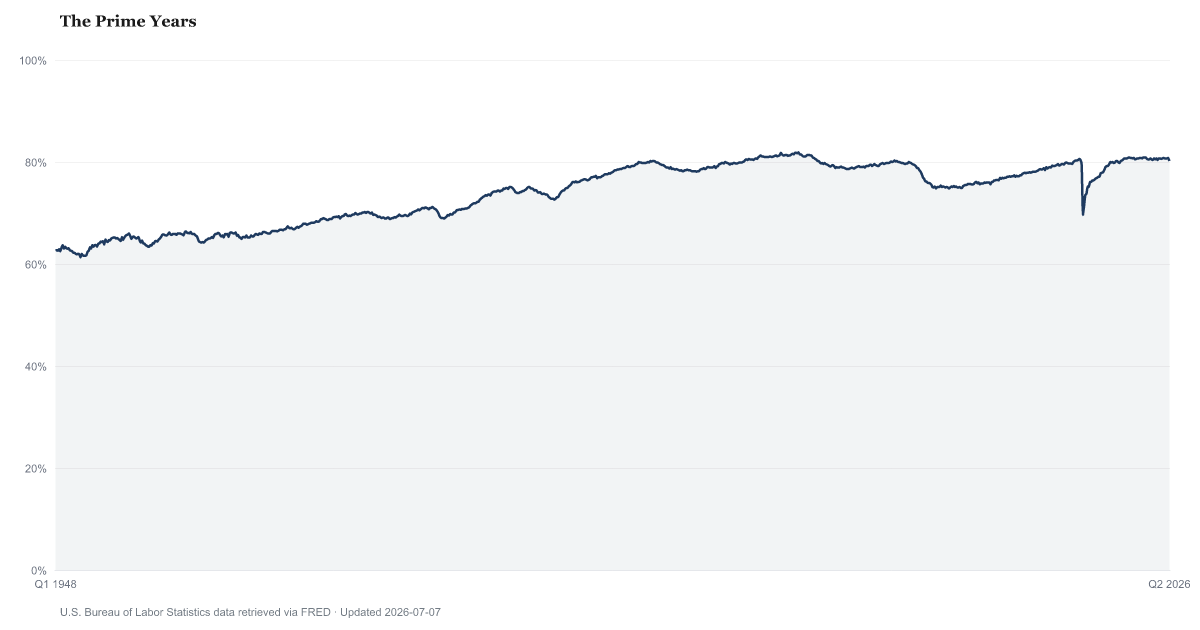
The U.S. prime-age employment rate was 80.4% in August 2026, little changed from 80.7% a year earlier, according to the U.S. Bureau of Labor Statistics. It is the share of civilians ages 25 to 54, outside institutions, who held a job in the survey week. Source: BLS Current Population Survey (LNS12300060).
Among people ages 25 to 54 in the U.S., 80.4% had a job in August 2026, little changed from 80.7% a year earlier.
A month earlier, in July 2026, the rate was the same.
The rate divides employed people ages 25 to 54 by everyone in that age group, working or not, outside prisons, nursing homes and the military. Employed means working at least one hour for pay or profit in the survey week, being temporarily away from a job, or working 15 hours or more unpaid in a family business. It says nothing about hours, pay or whether the job is full time. Ages 25 to 54 leave out most students and retirees, so the rate is less affected by the population growing older.
The rate is seasonally adjusted, which removes the usual swings of the calendar. It comes from a sample survey, and BLS publishes no margin of error for this age group. For the employment rate of everyone 16 and older, a one-month change must exceed about 0.25 percentage point (a point on the percent scale, not a percent of the rate) to stand out from sampling error. By our estimate the margin for ages 25 to 54 is about 0.3 point. Smaller moves are described here as little changed.
Comparisons on this page start in 1994, when BLS redesigned the survey questionnaire. New population estimates arrive each January and are not carried back, so a December-to-January change partly reflects that update. The survey did not run in October 2025, during the federal government shutdown. BLS has also said that in April 2020 some people kept away from work by pandemic closures were counted as employed when they should have been counted as unemployed on temporary layoff, so the rate for that month is likely too high.
This is not the headline employment-population ratio in the monthly jobs report, which covers everyone 16 and older. It is also not the prime-age participation rate, which counts people looking for work as well as those working. The Unemployment Rate and U-6 Underemployment come from the same survey, and Nonfarm Payrolls counts jobs from a separate survey of employers.
Prime-Age Employment Rate (25-54) over time: what has changed?

Counties with the highest labor scores
These are labor scores from our County Distress Index, not county readings of Prime-Age Employment Rate (25-54).
Explore all 3,144 counties →| Period | Value | YoY Change |
|---|---|---|
| Aug 2026 | 80.4% | -0.3 pp |
| Jul 2026 | 80.4% | 0 pp |
| Jun 2026 | 80.2% | -0.5 pp |
| May 2026 | 80.8% | +0.3 pp |
| Apr 2026 | 80.7% | 0 pp |
| Mar 2026 | 80.7% | +0.3 pp |
| Feb 2026 | 80.7% | +0.2 pp |
| Jan 2026 | 80.8% | +0.1 pp |
| Dec 2025 | 80.7% | +0.2 pp |
| Nov 2025 | 80.6% | +0.1 pp |
| Sep 2025 | 80.7% | -0.2 pp |
| Aug 2025 | 80.7% | -0.2 pp |
How to read this series
The source changed how it measures this in Jan 1994. BLS redesigned the Current Population Survey questionnaire and collection methods in January 1994 and says comparability with earlier data is affected. Readings on either side are not directly comparable, so the year-over-year column stays blank where a comparison would cross that date. Source documentation.
Frequently Asked Questions
What is the prime-age employment rate now?
BLS's latest figure, for August 2026, is 80.4%. That is little changed from a year earlier, when it was 80.7%. It covers people ages 25 to 54, not all adults.
Is 100 minus this rate the prime-age unemployment rate?
No. This rate divides the employed by everyone ages 25 to 54, including people not looking for work. The unemployment rate divides the unemployed by the labor force only. People ages 25 to 54 without a job include the unemployed as well as students, caregivers, people with disabilities and others outside the labor force.
Does it mean more people have jobs?
Not by itself. It is a ratio, so it can change when the population estimate changes, as it does each January, even if the number of people working does not. Counts of jobs come from a separate survey of employers.
Where does this data come from?
BLS estimates it each month from the Current Population Survey, a survey of about 60,000 households that the Census Bureau runs for BLS. It is released with the Employment Situation report, usually on the first Friday of the following month.

Quick poll
Is this affecting you or your household?
Discussion
Get the numbers when they move.
New data drops, indicator updates, and American Distress Index changes — delivered when it matters. No spam.
or Create an Account for full access
Loading comments…