Total Nonfarm Payrolls
Total employment in the U.S. nonfarm economy
What is the current Total Nonfarm Payrolls?
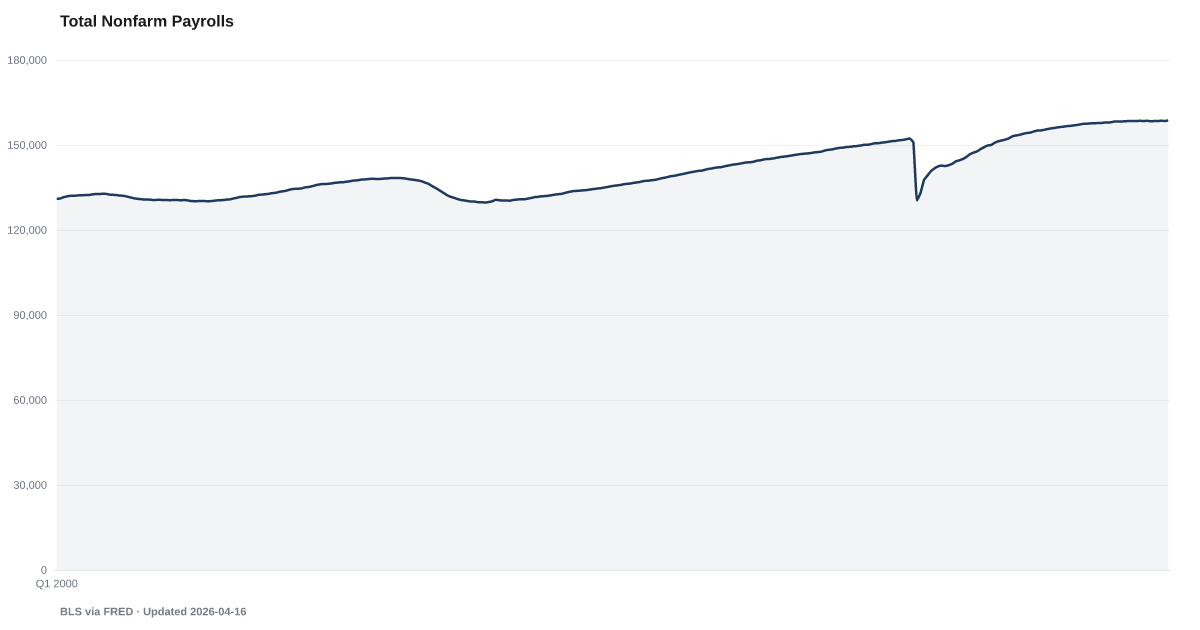
Total nonfarm payrolls stood at 158.5 million in the latest BLS report. This headline employment number tracks the total number of paid workers in the U.S. economy excluding farm workers and a few other categories. Month-over-month changes signal the pace of job creation or destruction. Source: BLS via FRED (PAYEMS).
Total U.S. employment reached 159,001 in May 2026 — but the headline count is a stock, not a flow, and the flow underneath has been slowing for two years.
BLS nonfarm payroll employment set a new all-time high in May 2026. It is also roughly where the series has sat for six months. Month-over-month growth has been running in the low six figures and, in some recent readings, below it. The level is elevated. The momentum has flattened.
A payroll count is a stock measurement. It reflects the net of hires and separations across roughly 144,000 surveyed establishments each month. When the net number grows, employment rises. When it flattens, it means hiring and separation are in rough balance — which is what the Indeed Job Postings Index shows from the demand side, and what the JOLTS Quits Rate at the low end of its post-2015 range shows from the worker side.
The composition matters more than the top-line figure. Recent growth has leaned on health care, government, and leisure-and-hospitality — sectors where automation exposure is lower and where much of the hiring replaces pre-pandemic losses. Information sector employment, captured in The Tech Drought, has been falling. The jobs being added are not the ones that disappeared.
A historically large employment count coexists easily with rising distress. Youth Unemployment has drifted higher even as the headline count stayed large. Continued Unemployment Claims has moved up as laid-off workers stay jobless longer. The BLS payroll number is the cleanest piece of good news in the labor complex right now. It is also the least responsive one — which is why the faster series deserve at least as much attention.
Explore Further
How has Total Nonfarm Payrolls changed over time?

Most affected counties
Counties with the highest labor scores in the County Distress Index.
Explore all 3,144 counties →| Period | Value | YoY Change |
|---|---|---|
| May 2026 | 159,001 | +503.00 |
| Apr 2026 | 158,829 | +344.00 |
| Mar 2026 | 158,650 | +273.00 |
| Feb 2026 | 158,436 | +126.00 |
| Jan 2026 | 158,592 | +324.00 |
| Dec 2025 | 158,432 | +116.00 |
| Nov 2025 | 158,449 | +370.00 |
| Oct 2025 | 158,408 | +463.00 |
| Sep 2025 | 158,548 | +636.00 |
| Aug 2025 | 158,472 | +715.00 |
| Jul 2025 | 158,542 | +794.00 |
| Jun 2025 | 158,478 | +783.00 |
Frequently Asked Questions
What are total nonfarm payrolls?
Nonfarm payrolls count the total number of paid U.S. workers excluding farm employees, private household employees, and nonprofit organization employees. At 158.5 million, it is the broadest measure of U.S. employment.
Why do payrolls matter for the distress index?
Employment is the foundation of household income. Slowing payroll growth or outright job losses directly increase financial distress by reducing income available to service debt and cover expenses.
Where does this data come from?
Published monthly by the Bureau of Labor Statistics as part of the Current Employment Statistics survey, available via FRED series PAYEMS.

Quick poll
Is this affecting you or your household?
Discussion
Get the numbers when they move.
New data drops, indicator updates, and ADI score changes — delivered when it matters. No spam.
or Create an Account for full access
Loading comments…