Chapter 7 Bankruptcy Filings (YoY % Change)
Year-over-year change in 12-month Chapter 7 bankruptcy filings
What is the current Chapter 7 Bankruptcy Filings (YoY % Change) reading?
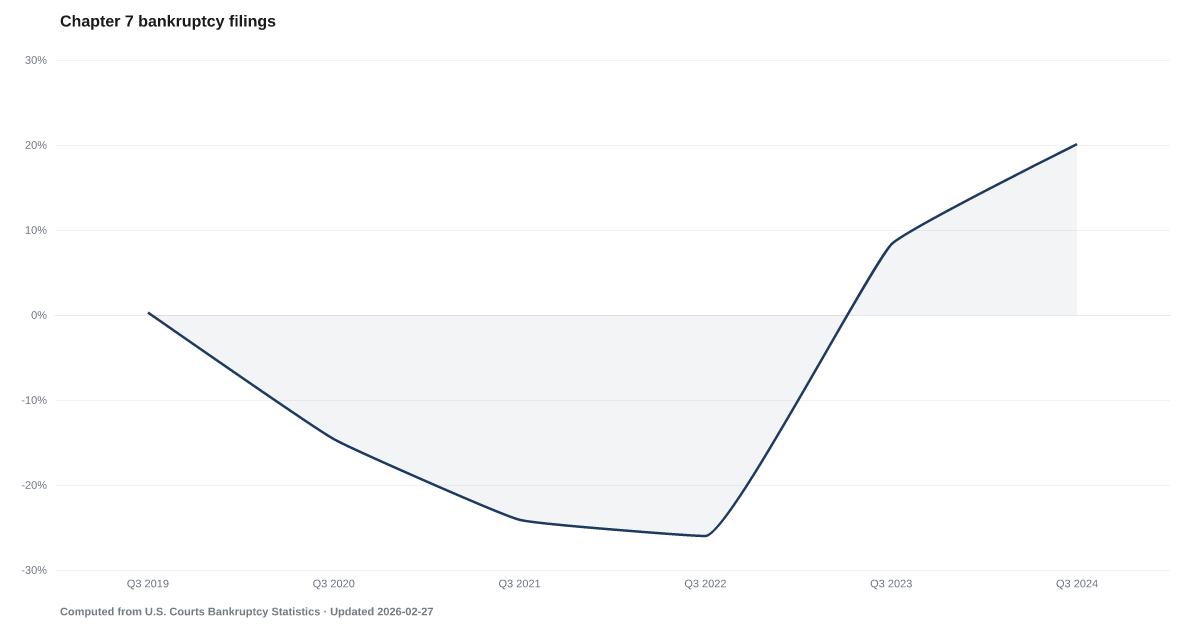
Over the 12 months through Q2 2026, Chapter 7 bankruptcy filings in U.S. courts were 14.7% higher than in the same 12 months a year earlier, by our calculation from Administrative Office of the U.S. Courts counts. That is down from a change of 17% for the 12 months through Q2 2025. The figure counts cases, business and nonbusiness, not people. Source: U.S. Courts, Table F-2.
In the 12 months through Q2 2026, bankruptcy courts logged 14.7% more Chapter 7 cases than a year earlier.
The Administrative Office of the U.S. Courts counts Chapter 7 cases filed in the federal bankruptcy courts over a rolling 12 months, business and nonbusiness together. We compare each 12-month total with the one ending on the same date a year earlier. For the 12 months through Q2 2026, the count was 14.7% higher than in the same 12 months a year earlier. That change is down from 17% a year earlier, in Q2 2025. It is the lowest year-over-year change since Q3 2023.
A change above zero means more Chapter 7 cases were filed than in the same 12 months a year earlier. When the change gets smaller but stays above zero, the count is still growing, only more slowly; it does not mean filings fell.
Growth has slowed from a year earlier for five straight quarters.
Chapter 7 is the liquidation chapter of the Bankruptcy Code: a trustee can sell property the law does not protect and pay creditors from the proceeds. Individuals, partnerships and corporations can all file under it. A filing starts a case; it does not show whether debts were discharged or the case was dismissed.
Each quarter brings a new 12-month total, so two readings in a row share nine of their 12 months. Chapter 13 filings, all bankruptcy filings and the chapter ratio use the same court tables. None of them says why people filed or why they chose one chapter over the other.
Explore Further
Is this happening to you?
Are you weighing your options for debts you can't pay?
Chapter 7 Bankruptcy Filings (YoY % Change) over time: what has changed?

Counties with the highest default and legal scores
These are default and legal scores from our County Distress Index, not county readings of Chapter 7 Bankruptcy Filings (YoY % Change).
Explore all 3,144 counties →| Period | Value | YoY Change |
|---|---|---|
| Q2 2026 | 14.7% | -2.3 pp |
| Q1 2026 | 15.3% | -2.6 pp |
| Q4 2025 | 14.8% | -4.1 pp |
| Q3 2025 | 15.5% | -4.6 pp |
| Q2 2025 | 17% | -2.2 pp |
| Q1 2025 | 17.9% | +0.3 pp |
| Q4 2024 | 18.9% | +3 pp |
| Q3 2024 | 20.1% | +11.8 pp |
| Q2 2024 | 19.2% | +19.5 pp |
| Q1 2024 | 17.6% | +30.4 pp |
| Q4 2023 | 15.9% | +37.7 pp |
| Q3 2023 | 8.3% | +34.3 pp |
Frequently Asked Questions
How much have Chapter 7 filings changed?
For the 12 months through Q2 2026, Chapter 7 filings were 14.7% higher than a year earlier, down from 17% in Q2 2025. We compute the change from the Courts' Table F-2 counts; it covers a full 12 months, not a single quarter.
What is Chapter 7 bankruptcy?
Chapter 7 is the liquidation chapter of the Bankruptcy Code. A trustee can sell property the law does not protect and pay creditors from the proceeds, and eligible debts can be discharged. Individuals and businesses can both file under it. A filing count does not show how a case ended.
Does the Chapter 7 figure count people?
No. It counts court cases. A married couple can file one joint petition, and business cases are included. The figure is also national: district changes differ, and Table F-2 reports districts separately.
Where does this data come from?
The Administrative Office of the U.S. Courts publishes Table F-2 each quarter with 12-month filing counts by chapter and district. It prints the Chapter 7 counts but not their percent change; American Default computes that from two tables. There is no fixed release calendar.


Quick poll
Is this affecting you or your household?
Discussion
Get the numbers when they move.
New data drops, indicator updates, and American Distress Index changes — delivered when it matters. No spam.
or Create an Account for full access
Loading comments…