Fannie Mae and Freddie Mac Loans in Forbearance
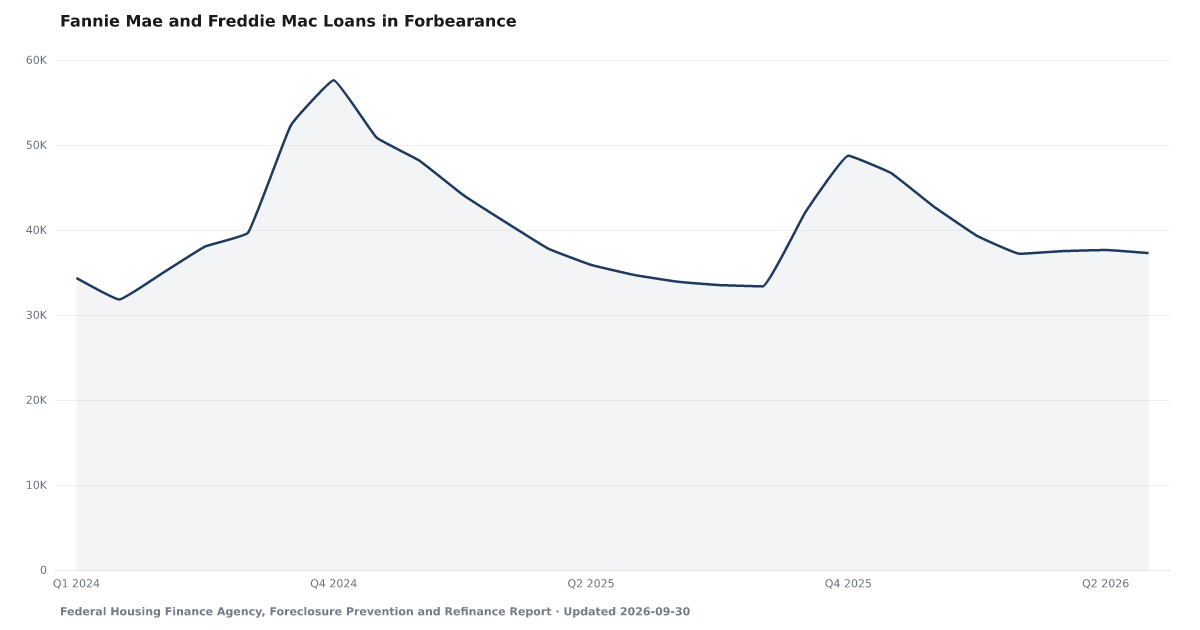
Fannie Mae and Freddie Mac loans on a forbearance plan at the end of each month
What is the current Fannie Mae and Freddie Mac Loans in Forbearance reading?
Fannie Mae and Freddie Mac had 37,283 loans on a forbearance plan at the end of June 2026, 2,570 more than a year earlier. Forbearance pauses or cuts the monthly payment for a set time. The count covers only the two companies' single-family loans. Source: Federal Housing Finance Agency, Foreclosure Prevention and Refinance Report.
Measurement basis: Number of Fannie Mae and Freddie Mac single-family loans in a forbearance plan at month end (FHFA: Inventory, number of loans at period end, Forbearance Plans). A forbearance plan reduces or suspends the monthly payment for a set period. A count of loans on a plan at that date, not of plans started or completed in the month. Read from the Highlights page of FHFA's Foreclosure Prevention and Refinance Report; a quarter-end month is published from the quarterly edition when it arrives. If a later monthly edition restates it, we log the new figure for review and keep the published one.
Fannie Mae and Freddie Mac had 37,283 loans in forbearance at the end of June 2026, 2,570 more than a year earlier.
Forbearance is a pause or a cut in a borrower's monthly mortgage payment for a set time, agreed with the servicer, the company the borrower pays each month. The Federal Housing Finance Agency counts the Fannie Mae and Freddie Mac loans on a forbearance plan on the last day of each month. At the end of June 2026 there were 37,283, up from 34,713 in June 2025.
A plan is both a sign of trouble and a form of help, so a larger count can mean more borrowers in trouble or more of them getting relief; the count alone does not say which. It is the number of loans on a plan at month end, not plans started or finished that month. Completed forbearance plans are part of Foreclosure Prevention Actions Completed, Fannie Mae and Freddie Mac Loans.
The count covers only single-family loans that Fannie Mae or Freddie Mac own or guarantee, not FHA, VA or bank-portfolio loans. A quarter-end month's count comes from FHFA's quarterly edition when it arrives. If a later monthly edition restates it, we log the new figure for review and keep the published one.
Explore Further
Fannie Mae and Freddie Mac Loans in Forbearance over time: what has changed?

Counties with the highest delinquency scores
These are delinquency scores from our County Distress Index, not county readings of Fannie Mae and Freddie Mac Loans in Forbearance.
Explore all 3,144 counties →| Period | Value | YoY Change |
|---|---|---|
| Jun 2026 | 37K | +2K |
| May 2026 | 38K | +2K |
| Apr 2026 | 38K | 0 |
| Mar 2026 | 37K | -4K |
| Feb 2026 | 39K | -5K |
| Jan 2026 | 43K | -5K |
| Dec 2025 | 47K | -4K |
| Nov 2025 | 49K | -9K |
| Oct 2025 | 42K | -10K |
| Sep 2025 | 33K | -7K |
| Aug 2025 | 34K | -4K |
| Jul 2025 | 34K | -1K |
Frequently Asked Questions
What is forbearance?
A pause or a cut in the monthly mortgage payment for a set time, agreed with the servicer. When the plan ends, FHFA's glossary says, the borrower resumes regular payments and pays toward what was missed, or works with the servicer on a permanent fix such as a loan modification.
Does a bigger count mean more households are in trouble?
Not on its own. A loan on a plan has hit trouble, and the plan is also help, so the count can grow with need or with relief. Read it beside Serious Delinquency Rate, Fannie Mae and Freddie Mac Loans and Foreclosure Starts, Fannie Mae and Freddie Mac Loans.
Does this count cover every mortgage?
No. It covers only single-family loans owned or guaranteed by Fannie Mae and Freddie Mac. FHA, VA and bank-portfolio loans are not in it.
Where does this data come from?
The Federal Housing Finance Agency's Foreclosure Prevention and Refinance Report, which FHFA publishes as a PDF with no release calendar: a monthly edition for eight months of the year and a quarterly edition for March, June, September and December. We read the Highlights table of each new edition with an automated parser and check every number against the PDF's own text before it is saved.

Quick poll
Is this affecting you or your household?
Discussion
Get the numbers when they move.
New data drops, indicator updates, and American Distress Index changes — delivered when it matters. No spam.
or Create an Account for full access
Loading comments…