Food Price Inflation (CPI)
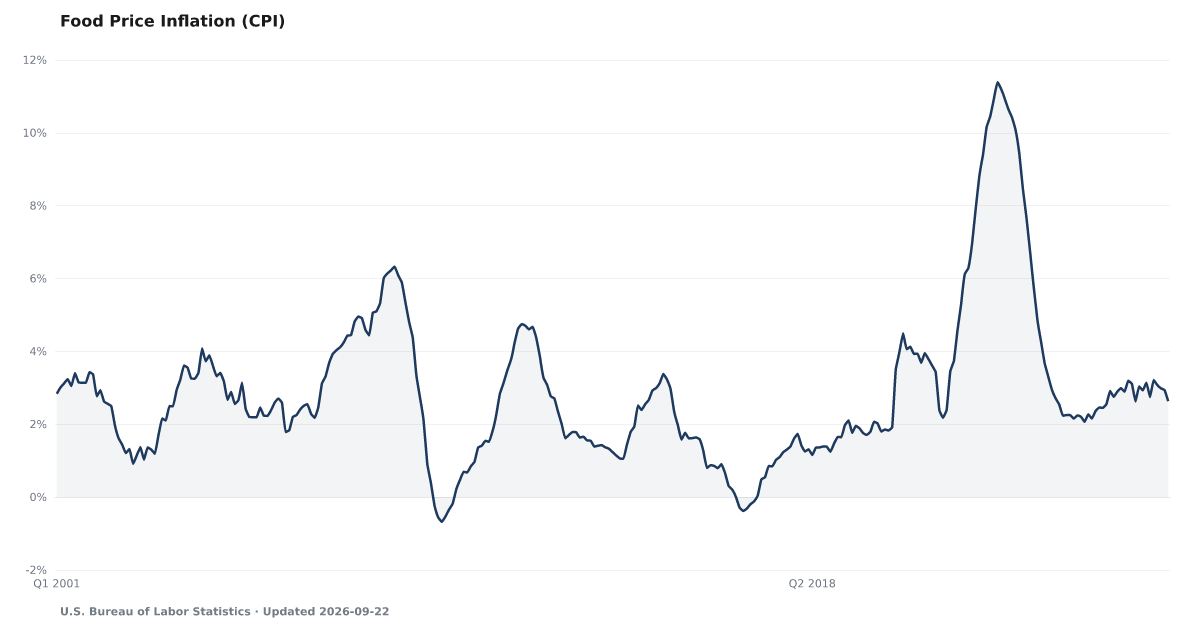
Year-over-year change in food prices
What is the current Food Price Inflation (CPI) reading?
Food prices were 2.6% higher than a year earlier in August 2026, down from a rate of 3.2% in August 2025, according to the U.S. Bureau of Labor Statistics consumer price index for food. The index covers groceries and restaurant meals. Source: BLS CPI (CUSR0000SAF1).
Measurement basis: Year-over-year percent change computed from the seasonally adjusted BLS Food CPI (CUSR0000SAF1); seasonally adjusted values may be revised
Food prices were 2.6% higher than a year earlier in August 2026, down from a rate of 3.2% in August 2025.
The Bureau of Labor Statistics tracks what people in cities and suburbs pay for food, at the grocery store and when they eat out. In August 2026 those prices were 2.6% higher than a year earlier. The yearly rate is down from 3.2% in August 2025. It edged down from 2.9% in July 2026, too small a move to call a turn.
A rate above zero means food prices are still going up, even when the rate is lower than before. They have not come down. Grocery Prices Cumulative Change Since Jan 2020 tracks the total change since January 2020, and the grocery affordability gap sets food prices against wages.
This measure covers all food. The grocery-only measure is the BLS food-at-home index. We compute the yearly change from the seasonally adjusted index, so it can differ slightly from the 12-month figure BLS headlines, which uses the unadjusted index. There is no figure for October 2025, when the federal government shutdown stopped data collection.
Explore Further
Food Price Inflation (CPI) over time: what has changed?

Counties with the highest debt burden scores
These are debt burden scores from our County Distress Index, not county readings of Food Price Inflation (CPI).
Explore all 3,144 counties →| Period | Value | YoY Change |
|---|---|---|
| Aug 2026 | 2.6% | -0.6 pp |
| Jul 2026 | 2.9% | 0 pp |
| Jun 2026 | 3% | 0 pp |
| May 2026 | 3.1% | +0.2 pp |
| Apr 2026 | 3.2% | +0.4 pp |
| Mar 2026 | 2.7% | -0.2 pp |
| Feb 2026 | 3.1% | +0.5 pp |
| Jan 2026 | 2.9% | +0.5 pp |
| Dec 2025 | 3% | +0.5 pp |
| Nov 2025 | 2.6% | +0.2 pp |
| Sep 2025 | 3.1% | +0.8 pp |
| Aug 2025 | 3.2% | +1.1 pp |
Frequently Asked Questions
How fast are food prices changing?
Food prices were 2.6% higher than a year earlier in August 2026, down from a rate of 3.2% in August 2025, based on the seasonally adjusted BLS food index (CUSR0000SAF1).
Why does food inflation matter for financial distress?
Food is spending a household cannot skip, so it is one of the costs the American Distress Index follows. This page reports what the price index did; it does not measure what any household spent or how it coped.
Where does food CPI data come from?
The Bureau of Labor Statistics publishes the food index every month in its consumer price index report. We use the seasonally adjusted series CUSR0000SAF1 and compute the change from a year earlier.

Quick poll
Is this affecting you or your household?
Discussion
Get the numbers when they move.
New data drops, indicator updates, and American Distress Index changes — delivered when it matters. No spam.
or Create an Account for full access
Loading comments…