The Warning Light
Below the 80-point threshold that has preceded every recession since 1967
What is the current The Warning Light?
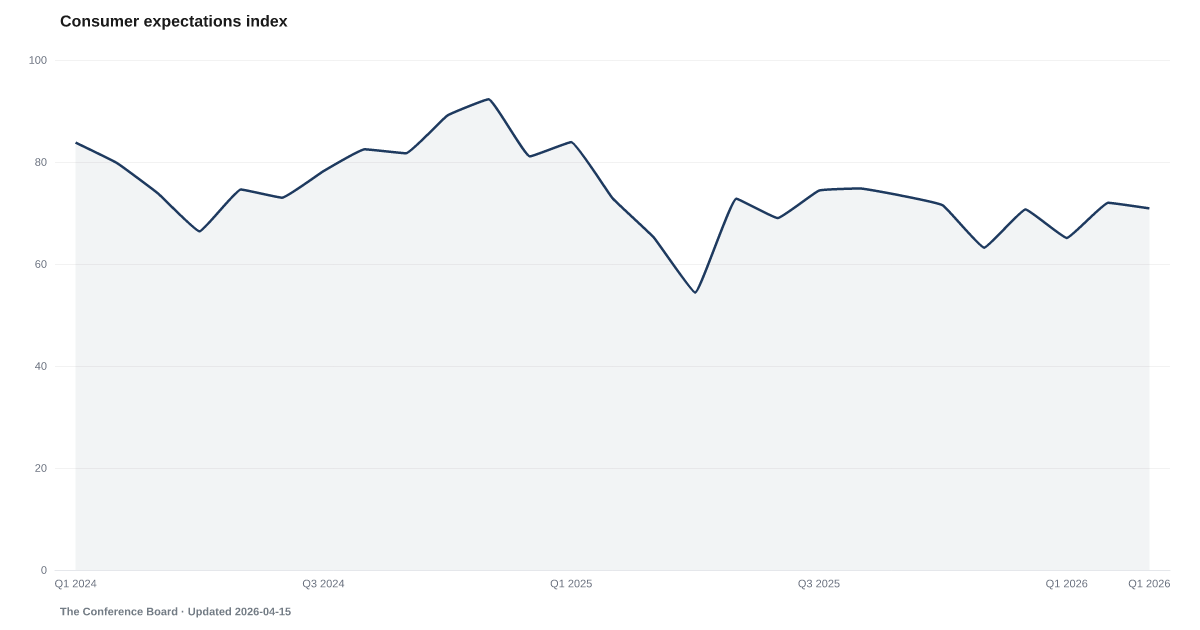
The Conference Board Consumer Expectations Index registered 74.4 in May 2026, well below the 80-point threshold that has preceded every U.S. recession since 1967. The index has been below this signal for an extended stretch, marking the longest sustained sub-80 reading outside of an active recession in the series' history. Source: The Conference Board.
The Conference Board's expectations index has been flashing its recession signal for over a year — every time this has happened before, a recession followed.
The Conference Board Consumer Expectations Index registered 74.4 in May 2026 — well below the 80-point threshold that has preceded every U.S. recession since 1967. The index has been below this threshold continuously since early 2025. The April 2025 reading of 54.4 was especially depressed within the recent run; while the index has bounced modestly since, it has not come close to clearing the signal line.
What distinguishes this indicator from pure sentiment surveys is its recession-signal history. The Conference Board expectations index specifically asks consumers about their outlook for income, business conditions, and employment over the next six months. When expectations fall below 80 and stay there, it has historically preceded GDP contraction by 6–12 months.
The Mood Ring — Michigan's sentiment survey — corroborates the pattern: consumer sentiment remains at levels typically associated with recessionary periods. The question is whether this time is different. Some analysts argue that the signal is distorted by political polarization, which has increasingly colored consumer survey responses. But The Tightening — the Chicago Fed's leverage conditions index — shows financial conditions tightening quickly, suggesting the pessimism is grounded in financial reality. The Buffer at historically low levels confirms that consumers have less cushion to absorb any downturn these expectations may be anticipating.
Explore Further
Is this happening to you?
Are you putting off a major purchase because you're unsure about the next six months?
How has The Warning Light changed over time?

Most affected counties
Counties with the highest debt burden scores in the County Distress Index.
Explore all 3,144 counties →| Period | Value | YoY Change |
|---|---|---|
| May 2026 | 74.4 | +1.60 |
| Apr 2026 | 73.4 | +19.00 |
| Mar 2026 | 71 | +5.80 |
| Feb 2026 | 72 | −0.90 |
| Jan 2026 | 65.1 | −18.80 |
| Dec 2025 | 70.7 | −10.40 |
| Nov 2025 | 63.2 | −29.10 |
| Oct 2025 | 71.5 | −17.60 |
| Sep 2025 | 73.4 | −8.30 |
| Aug 2025 | 74.8 | −7.70 |
| Jul 2025 | 74.4 | −3.80 |
| Jun 2025 | 69 | −4.00 |
Frequently Asked Questions
What is the Conference Board Consumer Expectations Index?
It measures consumers' six-month outlook for income, business conditions, and employment. A reading below 80 has preceded every U.S. recession since 1967. The current reading is 74.4 as of May 2026.
How long has the recession signal been active?
The index has been below its 80-point recession threshold for an extended stretch, with the May 2026 reading at 74.4. The cycle low was reached in early 2025. While the index has bounced modestly, it has not broken back above the threshold.
Has this signal ever been wrong?
Every prior sustained breach below 80 has been followed by a recession within 6–12 months. Some analysts argue the current signal may be distorted by political polarization, which increasingly colors survey responses. The signal nonetheless remains in the historically reliable danger zone.
How does this differ from the Michigan consumer sentiment survey?
The Conference Board expectations index specifically asks about the six-month outlook, while Michigan measures broader sentiment about current and future conditions. Both are currently signaling distress.
Where does the consumer expectations data come from?
The Conference Board publishes the Consumer Confidence Index monthly, based on a survey of approximately 3,000 households. The expectations component, which looks ahead six months, is the subindex tracked by the ADI.

Quick poll
Is this affecting you or your household?
Discussion
Get the numbers when they move.
New data drops, indicator updates, and ADI score changes — delivered when it matters. No spam.
or Create an Account for full access
Loading comments…