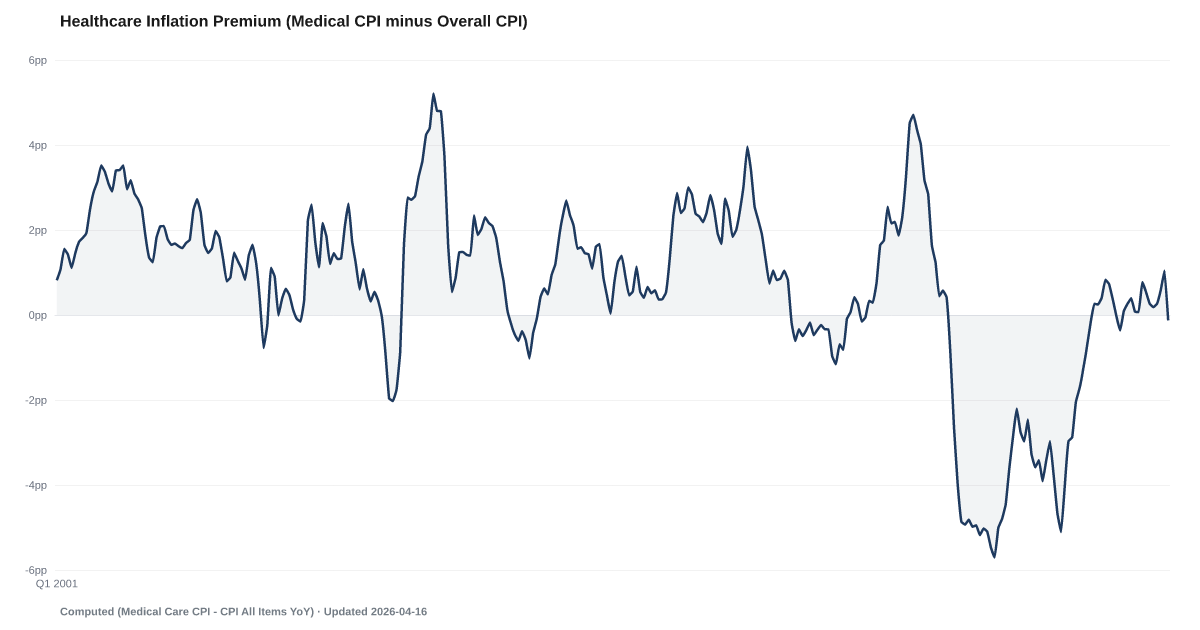
Healthcare Inflation Premium (Medical CPI minus Overall CPI)
Gap between medical care inflation and the overall Consumer Price Index
In our research, changes in this measure have tended to show up in Initial Unemployment Claims (SA) about 2 quarters later. How we tested this
What is the current Healthcare Inflation Premium (Medical CPI minus Overall CPI) reading?
The Healthcare Inflation Premium is the yearly change in the U.S. Bureau of Labor Statistics medical care price index minus the yearly change in the all-items index, in percentage points. For August 2026 it reads 1.8 percentage points below zero. That reading is down from 0.5 percentage points in August 2025. It measures price growth only, not what households paid or could afford. Source: BLS CPI medical care (CUSR0000SAM) and all items (CPIAUCSL), seasonally adjusted; gap calculated by American Default Research.
Measurement basis: Percentage-point difference between year-over-year changes in the seasonally adjusted Medical Care CPI (CUSR0000SAM) and seasonally adjusted all-items CPI-U (CPIAUCSL); seasonally adjusted values may be revised
In the 12 months to August 2026, medical care price growth trailed overall price growth by 1.8 percentage points.
The Healthcare Inflation Premium sets two Bureau of Labor Statistics price measures side by side: the yearly change in the consumer price index for medical care, and the yearly change for all items. Over the 12 months to August 2026, the medical care rate was 1.8 percentage points below the overall rate. The gap is down from 0.5 percentage points in August 2025. A month earlier, in July 2026, it was higher, at -1.6 percentage points. It is the lowest reading since January 2024.
A reading below zero means medical care prices went up more slowly than consumer prices overall, or came down. It does not by itself mean medical care got cheaper. The gap is measured in percentage points: it is the difference between two percent changes, not a percent of anything. It has been on both sides of zero many times since 2001, and BLS gives no cause for its sign or size.
The medical care index prices doctor and hospital services, drugs, supplies and health insurance, counting the full amount paid to the provider, the insurer's share included. It is not what patients pay out of pocket, and the word premium here means the gap, not an insurance premium: BLS prices health insurance from insurers' retained earnings, not from premiums. Medical Care CPI shows the medical rate on its own, and CPI Inflation Rate (All Items) the overall rate it is set against.
American Default Research computes the gap from the seasonally adjusted indexes, meaning BLS has removed the usual calendar swings; BLS headlines 12-month changes from the unadjusted ones and does not publish this gap. BLS changed how it prices health insurance from October 2023 and began using claims data for doctor and outpatient hospital prices from October 2024, so comparisons across those dates compare different methods. There is no reading for October 2025, when the federal government shutdown stopped data collection, and there will be none for October 2026. The CPI covers urban consumers, over 90 percent of the U.S. population.
Explore Further
Healthcare Inflation Premium (Medical CPI minus Overall CPI) over time: what has changed?

Counties with the highest debt burden scores
These are debt burden scores from our County Distress Index, not county readings of Healthcare Inflation Premium (Medical CPI minus Overall CPI).
Explore all 3,144 counties →| Period | Value | YoY Change |
|---|---|---|
| Aug 2026 | -1.8 pp | -2.3 pp |
| Jul 2026 | -1.6 pp | -2.4 pp |
| Jun 2026 | -1.4 pp | -1.5 pp |
| May 2026 | -1.6 pp | -1.7 pp |
| Apr 2026 | -1.2 pp | -1.6 pp |
| Mar 2026 | -0.2 pp | — |
| Feb 2026 | 0.9 pp | — |
| Jan 2026 | 0.8 pp | — |
| Dec 2025 | 0.5 pp | — |
| Nov 2025 | 0.2 pp | — |
| Sep 2025 | 0.3 pp | -0.5 pp |
| Aug 2025 | 0.5 pp | +0.1 pp |
Frequently Asked Questions
What is the healthcare inflation premium?
It is the yearly change in medical care CPI minus the yearly change in all-items CPI, in percentage points. The August 2026 reading is 1.8 percentage points below zero, meaning medical care prices grew more slowly than prices overall, or came down. A month earlier, in July 2026, the gap was higher, at -1.6 percentage points.
Does a negative reading mean health care got cheaper?
No. A negative reading means medical care prices rose more slowly than prices overall. Medical care prices can still be above their level a year earlier; Medical Care CPI shows that rate on its own. The gap also says nothing about insurance premiums or what households paid out of pocket.
Where does this data come from?
Both rates come from the Bureau of Labor Statistics consumer price index, published monthly between the 10th and 14th of the following month. American Default Research computes the gap from the seasonally adjusted series CUSR0000SAM (medical care) and CPIAUCSL (all items). It is a national figure, not available for states or counties, and it is not an input to the American Distress Index.


Discussion
Get the numbers when they move.
New data drops, indicator updates, and American Distress Index changes — delivered when it matters. No spam.
or Create an Account for full access
Loading comments…