Median Sale Price of New Houses (US)
Median price of new single-family houses sold in the United States
What is the current Median Sale Price of New Houses (US) reading?
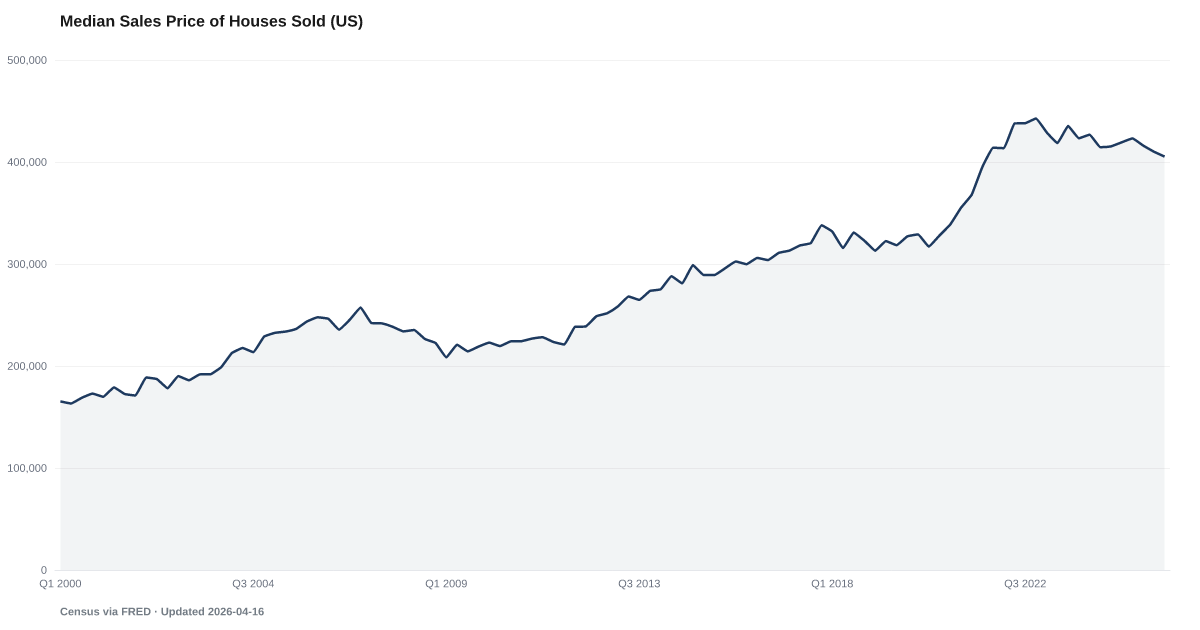
The median sales price of new single-family houses sold in the U.S. was $410,700 in Q2 2026, according to the U.S. Census Bureau and U.S. Department of Housing and Urban Development, little changed from $416,100 a year earlier. It covers newly built houses only, not resales of existing homes. Source: U.S. Census Bureau, New Residential Sales (Q2 2026), data retrieved via FRED series MSPUS.
Newly built U.S. houses sold for a median $410,700 in Q2 2026, little changed from a year earlier.
The Census Bureau's survey of new home sales puts the Q2 2026 median at $410,700, little changed from $416,100 a year earlier. It was about the same as in Q1 2026, a move within the survey's margin and the usual seasonal swing.
The newest quarter is preliminary and is revised when the next quarter comes out.
This is the price of newly built single-family houses, land included, agreed when the contract is signed. Resales of existing homes are not in it, and neither are condos in multifamily buildings, manufactured homes or houses built for rent. The price leaves out options paid for separately, so it is not the full cost to the buyer. It is a national figure; the survey reports only the U.S. and four regions.
The median is estimated from a sample of building permits, and Census puts its relative standard error at about 3 percent, so a move of less than about 3 percent can be sampling noise. A change in the median also mixes real price changes with shifts in where and what size of houses were sold, so it does not show what the same house would sell for. For that, a repeat-sales index such as the FHFA House Price Index is the better guide.
For reference, the median was $327,100 in the fourth quarter of 2019 and $442,600 in the fourth quarter of 2022, in the current published figures. Census revised its 2020 to 2024 prices in May 2024, so older quotes of these quarters can differ.
Price is only part of what a buyer pays each month. Shelter CPI tracks the ongoing cost of housing for renters and owners, and mortgage rates and incomes come from other series. This median alone is not an affordability measure.
Explore Further
Median Sale Price of New Houses (US) over time: what has changed?

Counties with the highest debt burden scores
These are debt burden scores from our County Distress Index, not county readings of Median Sale Price of New Houses (US).
Explore all 3,144 counties →| Period | Value | YoY Change |
|---|---|---|
| Q2 2026 | $410.7K | -$5.4K |
| Q1 2026 | $408.5K | -$14.6K |
| Q4 2025 | $412.3K | -$7K |
| Q3 2025 | $410.1K | -$5.2K |
| Q2 2025 | $416.1K | +$1.6K |
| Q1 2025 | $423.1K | -$3.7K |
| Q4 2024 | $419.3K | -$3.9K |
| Q3 2024 | $415.3K | -$20.1K |
| Q2 2024 | $414.5K | -$4K |
| Q1 2024 | $426.8K | -$2.2K |
| Q4 2023 | $423.2K | -$19.4K |
| Q3 2023 | $435.4K | -$2.6K |
Frequently Asked Questions
What is the median price of a new house in the U.S.?
Census puts the median sales price of new houses sold at $410,700 for Q2 2026, little changed from $416,100 a year earlier. Half of the new houses sold that quarter went for less and half for more.
Is this the median price of all homes sold?
No. It covers newly built single-family houses only. The National Association of Realtors publishes a separate median for existing homes sold, including condos and co-ops, from closed sales, and the two cannot be compared as like for like.
Is the median new-home price at a record high?
No. Of 254 quarters since 1963, the latest ranks 17th highest. These are current dollars, not adjusted for inflation.
Where does this data come from?
The Census Bureau and HUD publish it from the Survey of Construction, a sample of building permits followed through to sale. The quarterly median comes out with the New Residential Sales release for the last month of each quarter, and the previous quarter is revised at the same time.


Quick poll
Is this affecting you or your household?
Discussion
Get the numbers when they move.
New data drops, indicator updates, and American Distress Index changes — delivered when it matters. No spam.
or Create an Account for full access
Loading comments…