Energy Cost Burden (Energy PCE as % of Disposable Income)
Also tracked as The Energy Squeeze
U.S. energy spending as a share of after-tax income
What is the current Energy Cost Burden (Energy PCE as % of Disposable Income) reading?
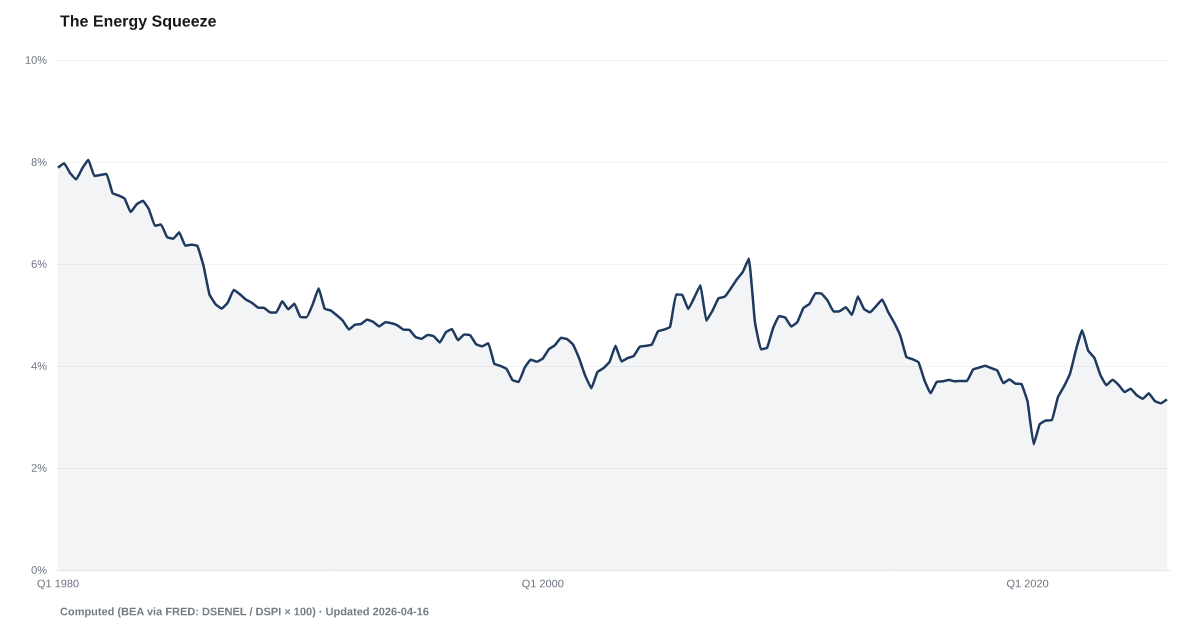
Energy took 3.7% of U.S. disposable personal income in Q2 2026, up from 3.3% a year earlier, according to U.S. Bureau of Economic Analysis data. The share adds up spending on gasoline and other fuels and on electricity and natural gas, then divides by after-tax income for the whole country. Source: BEA data retrieved via FRED, computed by American Default (Q2 2026).
U.S. spending on energy equaled 3.7% of after-tax personal income in Q2 2026, up from 3.4% in Q1 2026, the highest share since Q3 2023.
The energy cost burden divides what people spend on gasoline, heating fuel, electricity and natural gas by disposable personal income, the income left after taxes. In Q2 2026 that share was 3.7%, higher than the 3.3% of a year earlier. From Q1 2026 it was up 0.3 percentage points. Both figures are seasonally adjusted, so the usual winter and summer swings are already taken out.
The share has not been this high since Q3 2023. The latest BEA figures revised Q1 2026 down to 3.4%. The newest quarter will be revised again as BEA updates its estimates.
The share alone does not say why it is where it is. Energy spending depends on both prices and how much energy people buy, and the share also depends on income. Prices are tracked on their own by Energy CPI, and the pump price against pay by the gas-price-to-pay ratio.
This is one national ratio, not a typical household's bill. More than half of the energy spending is gasoline and other fuels, not utility bills. Both totals come from the Bureau of Economic Analysis and cover households together with nonprofits that serve them, so higher-income households weigh more. It is a different measure from the Department of Energy's low-income energy burden, which counts home energy only and divides by pre-tax income, and it does not say how many households struggle to pay. American Default computes it from two BEA series on FRED; BEA does not publish it as a single figure.
Explore Further
Is this happening to you?
Have your electric or gas bills changed how you heat or cool your home?
Energy Cost Burden (Energy PCE as % of Disposable Income) over time: what has changed?

Counties with the highest debt burden scores
These are debt burden scores from our County Distress Index, not county readings of Energy Cost Burden (Energy PCE as % of Disposable Income).
Explore all 3,144 counties →| Period | Value | YoY Change |
|---|---|---|
| Q2 2026 | 3.7% | +0.4 pp |
| Q1 2026 | 3.4% | -0.1 pp |
| Q4 2025 | 3.3% | 0 pp |
| Q3 2025 | 3.3% | -0.1 pp |
| Q2 2025 | 3.3% | -0.2 pp |
| Q1 2025 | 3.5% | 0 pp |
| Q4 2024 | 3.3% | -0.3 pp |
| Q3 2024 | 3.4% | -0.3 pp |
| Q2 2024 | 3.5% | -0.1 pp |
| Q1 2024 | 3.5% | -0.3 pp |
| Q4 2023 | 3.6% | -0.6 pp |
| Q3 2023 | 3.7% | -0.6 pp |
Frequently Asked Questions
What is the energy cost burden?
It is total U.S. spending on energy as a share of disposable personal income. In Q2 2026 it was 3.7%, up from 3.4% in Q1 2026. Energy here means gasoline and other fuels plus electricity and natural gas.
Is this how much a typical household spends on energy?
No. It divides one national spending total by one national income total, so it is not an average household's share. Lower-income households usually spend a larger share of income on energy, and this ratio does not show that.
Is the energy share at a record?
No. The latest quarter ranks 24th lowest of 186 quarters since 1980.
Where does this data come from?
Both parts come from the Bureau of Economic Analysis, republished on FRED: personal consumption spending on energy goods and services, and disposable personal income. A quarter's first reading arrives about a month after it ends and is revised in later BEA releases.


Quick poll
Is this affecting you or your household?
Discussion
Get the numbers when they move.
New data drops, indicator updates, and American Distress Index changes — delivered when it matters. No spam.
or Create an Account for full access
Loading comments…