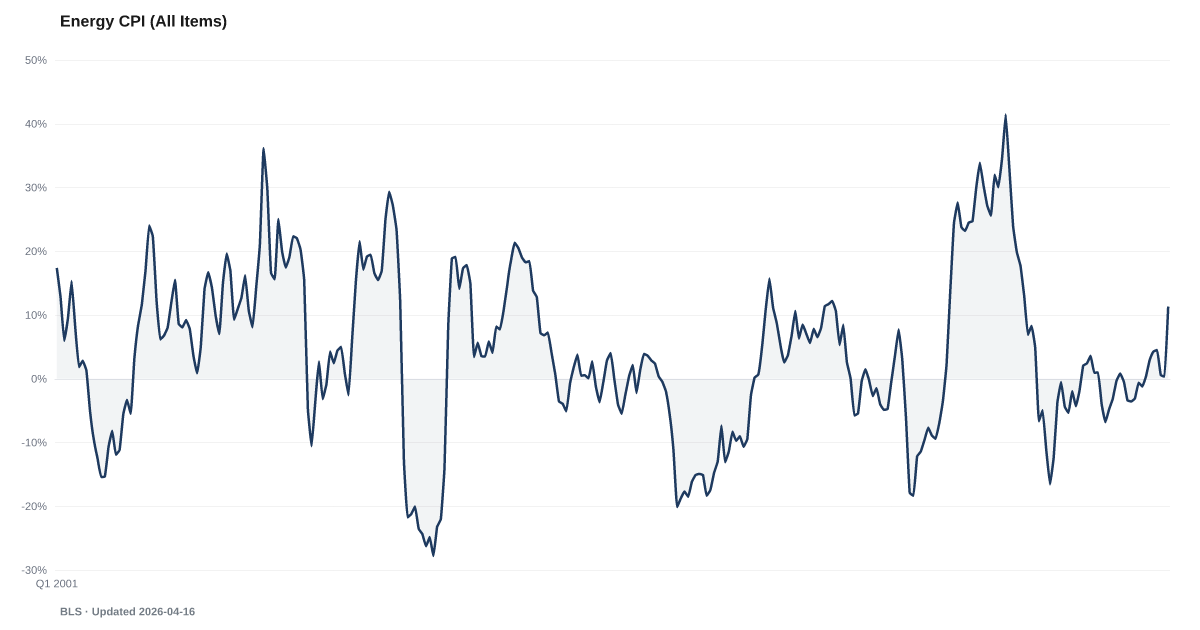
Energy CPI (All Items)
Year-over-year change in the energy component of the CPI
Validated leading indicator for Lower-Income Wage Growth vs. Inflation Gap (1q lag) — currently dormant. Lower-Income Wage Growth vs. Inflation Gap · View projections
What is the current Energy CPI (All Items)?
The energy Consumer Price Index rose 23.0% year-over-year in May 2026, marking a sharp reacceleration after the 2023–2024 stabilization. Energy costs remain volatile and disproportionately burden lower-income households, who spend a larger share of income on fuel and utilities. Source: BLS via FRED (CUSR0000SA0E).
Energy CPI has whiplashed from flat readings through 2025 to a 23% year-over-year reading in May 2026, according to BLS data.
The energy component of the Consumer Price Index is one of the most volatile lines in the whole index. It moves with oil. It moves with natural gas. It moves with everything that depends on either one. A 5 percent monthly move in the energy index is routine. A 10-point swing in a single month is not.
That is exactly what just happened. BLS data shows energy CPI ran negative or near-flat through most of 2025, then climbed back toward positive territory by year-end. The May 2026 print at 23% breaks out of that range sharply. One month of data does not establish a trend, but the size of the move deserves naming.
The context is a price level that already absorbed the 2022 shock, when energy CPI spiked 41 percent in a single year. Households are not paying 2019 energy bills. They are paying bills calibrated to post-shock price levels, which is why The Energy Squeeze, which measures energy spending as a share of disposable income, stopped improving in 2024 and has held flat ever since.
The year-over-year rate is volatile. The price level is the burden. If the recent spike holds or widens in subsequent months, the burden side starts moving again. If it reverses, the 2025 calm resumes. Either way, energy is one of the indicators most capable of moving fast enough to change the household budget picture in a single quarter.
Explore Further
How has Energy CPI (All Items) changed over time?

Most affected counties
Counties with the highest debt burden scores in the County Distress Index.
Explore all 3,144 counties →| Period | Value | YoY Change |
|---|---|---|
| May 2026 | 22.97% | +26.1 pts |
| Apr 2026 | 17.54% | +21.1 pts |
| Mar 2026 | 12.59% | +16.0 pts |
| Feb 2026 | 0.4% | +0.8 pts |
| Jan 2026 | -0.3% | −1.1 pts |
| Dec 2025 | 2.07% | +2.4 pts |
| Nov 2025 | 4.16% | +7.3 pts |
| Sep 2025 | 2.94% | +9.8 pts |
| Aug 2025 | 0.37% | +4.4 pts |
| Jul 2025 | -1.24% | −2.2 pts |
| Jun 2025 | -0.62% | −1.6 pts |
| May 2025 | -3.09% | −6.7 pts |
Frequently Asked Questions
What is the current energy inflation rate?
Energy CPI rose 23.0% year-over-year in the May 2026 BLS report. Energy prices remain volatile and have historically swung sharply with global oil markets and seasonal demand.
Why does energy cost matter for distress?
Energy is non-discretionary — households must heat their homes and fuel their commutes. Energy price spikes force immediate trade-offs with other spending categories.
Where does energy CPI data come from?
Published monthly by the Bureau of Labor Statistics, series CUSR0000SA0E.

Quick poll
Is this affecting you or your household?
Discussion
Get the numbers when they move.
New data drops, indicator updates, and ADI score changes — delivered when it matters. No spam.
or Create an Account for full access
Loading comments…