Federal Customs Duties as % of Disposable Personal Income
Also tracked as The Import Tax
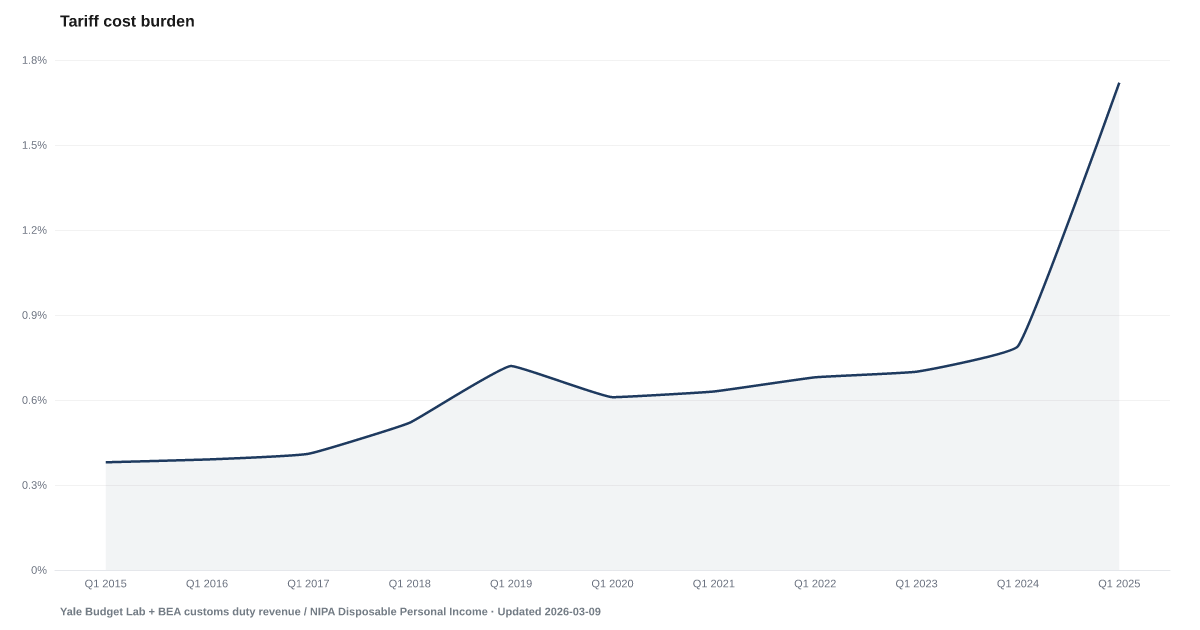
Federal customs-duty receipts as a share of aggregate disposable personal income
What is the current Federal Customs Duties as % of Disposable Personal Income reading?
In 2025, federal customs duties came to 1.16% of aggregate U.S. disposable personal income, up from 0.38% in 2024. The ratio divides the calendar-year customs-duties total from the U.S. Bureau of Economic Analysis by disposable personal income, also from BEA. It is not a tariff rate or a price effect, and it is not an estimate of the cost borne by an average household. BEA will revise recent years. Source: U.S. Bureau of Economic Analysis data retrieved via FRED (B235RC, A067RC), ratio calculated by American Default Research.
By American Default Research's calculation from Bureau of Economic Analysis data, federal customs duties equaled 1.16% of aggregate disposable personal income in 2025, up from 0.38% in 2024.
This series divides annual federal customs duties by annual U.S. disposable personal income. Both inputs are Bureau of Economic Analysis national accounts estimates in current dollars, and American Default Research computes the ratio; BEA does not publish it.
The 2025 ratio is the highest in our series, which starts in 2015; BEA's customs figures go back to 1929.
The ratio is not a household-incidence estimate. It does not determine how tariff costs are split among importers, producers, retailers and consumers, it is not a per-household cost, and it is not a tariff rate, which divides duties by the value of imports. Disposable income here is the total for all "persons" in the national accounts, including nonprofits that serve households, not the income of a typical family.
BEA's annual update, starting September 30, 2026, will revise the figures for 2021 through 2025. Separately, BEA says many duties collected in 2025 are being refunded after the Supreme Court struck down the tariffs imposed under the International Emergency Economic Powers Act. It records the refund, about $166 billion, as a capital transfer in the first quarter of 2026, not as lower customs duties, so this ratio does not net it out.
Read this fiscal ratio alongside CPI Inflation, car insurance inflation, and the grocery affordability gap as separate cost-pressure measures. None of those series identifies tariff pass-through by itself.
Explore Further
Is this happening to you?
Have import prices changed what you pay for everyday goods?
Federal Customs Duties as % of Disposable Personal Income over time: what has changed?

Counties with the highest debt burden scores
These are debt burden scores from our County Distress Index, not county readings of Federal Customs Duties as % of Disposable Personal Income.
Explore all 3,144 counties →| Period | Value | YoY Change |
|---|---|---|
| 2025 | 1.16% | +0.78 pp |
| 2024 | 0.38% | -0.01 pp |
| 2023 | 0.39% | -0.15 pp |
| 2022 | 0.54% | +0.07 pp |
| 2021 | 0.47% | +0.08 pp |
| 2020 | 0.39% | -0.09 pp |
| 2019 | 0.48% | +0.14 pp |
| 2018 | 0.34% | +0.08 pp |
| 2017 | 0.26% | -0.01 pp |
| 2016 | 0.27% | -0.01 pp |
| 2015 | 0.28% | — |
Frequently Asked Questions
What are federal customs duties as a share of income?
This measure reports federal customs-duty receipts as a share of aggregate disposable personal income: 1.16% in 2025. It measures the size of customs collections against the national income base, year by year.
Does this show how much tariffs cost my household?
No. It compares government receipts with the total income of everyone in the national accounts. It does not show who ends up paying tariffs, and it is not a per-household cost. Estimates of household costs, such as those from the Tax Foundation or the Yale Budget Lab, come from models and are different measures.
Where does this data come from?
Both inputs come from the Bureau of Economic Analysis national accounts: customs duties (series B235RC) and disposable personal income (A067RC), in current dollars. A new year first appears with BEA's advance estimate for the fourth quarter, and BEA revises past years in later releases and its annual update.


Quick poll
Is this affecting you or your household?
Discussion
Get the numbers when they move.
New data drops, indicator updates, and American Distress Index changes — delivered when it matters. No spam.
or Create an Account for full access
Loading comments…