Credit Card Delinquency at Banks Outside the Top 100
Also tracked as The Other Banks
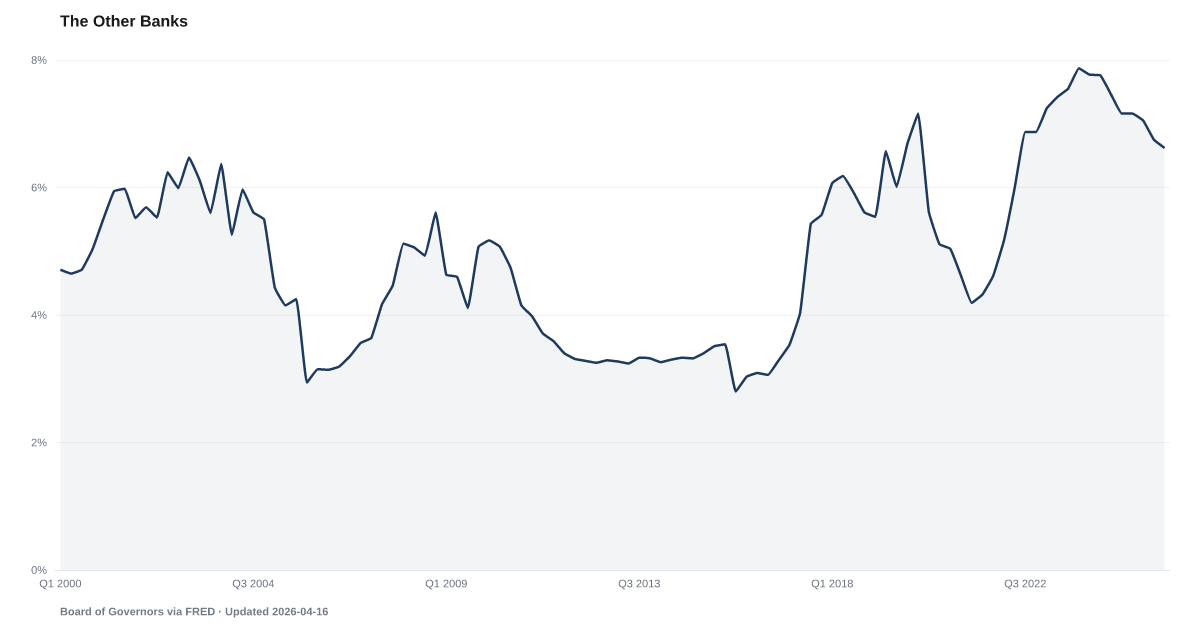
Share of credit card loan balances delinquent or in nonaccrual status
In our research, changes in Delinquency Rate on Consumer Loans (ex credit card) have tended to show up in this measure about 13 quarters later. How we tested this
What is the current Credit Card Delinquency at Banks Outside the Top 100 reading?
Credit card delinquency at U.S. commercial banks outside the 100 largest was 6.5% in Q2 2026, down from 7% a year earlier, according to the Board of Governors of the Federal Reserve System. It is the share of those banks' card balances that are 30 or more days past due or in nonaccrual status. Source: Federal Reserve Board data retrieved via FRED (DRCCLOBS).
Measurement basis: 30+ days past due or in nonaccrual status, per the Federal Reserve Board Charge-Off and Delinquency Rates release
Credit card delinquency at commercial banks outside the 100 largest was 6.5% in Q2 2026, down from 7% a year earlier.
The Federal Reserve Board reports that 6.5% of credit card balances at banks outside the 100 largest were 30 or more days past due or in nonaccrual status in Q2 2026, little changed from 6.4% in Q1 2026. That is lower than a year earlier, when it was 7%.
The Fed re-estimates its seasonally adjusted figures after they first come out, so the newest quarter can still be revised.
The group is every insured U.S.-chartered commercial bank smaller than the 100 largest by assets. By our arithmetic from the Fed's tables, these banks hold only about 3 percent of the credit card loans at commercial banks, so this rate describes a small corner of card lending, not card debt as a whole. Credit unions, savings institutions and card companies that are not banks are outside it.
It is a share of card balances, not of cardholders or accounts. A card counts once the minimum payment has been missed for two or more billing cycles, and the whole balance counts, not just the missed payment. Balances the bank has stopped booking interest on (nonaccrual) count too. The Fed seasonally adjusts the rate, taking out the usual pattern across the year so one quarter can be read against the one before. It gives no reason for the gap between bank size groups, and some single-quarter changes of a point or more have come with no explanation.
The rate for all commercial banks, which the largest card lenders dominate, is Credit Card Delinquency. The bank-size spread subtracts the top-100 rate from this one, quarter by quarter. Losses these banks write off are a separate measure, reported as Credit Card Charge-Offs for all banks.
Explore Further
Is this happening to you?
Do you carry a credit card balance from month to month?
Credit Card Delinquency at Banks Outside the Top 100 over time: what has changed?

Counties with the highest delinquency scores
These are delinquency scores from our County Distress Index, not county readings of Credit Card Delinquency at Banks Outside the Top 100.
Explore all 3,144 counties →| Period | Value | YoY Change |
|---|---|---|
| Q2 2026 | 6.5% | -0.5 pp |
| Q1 2026 | 6.4% | -0.8 pp |
| Q4 2025 | 6.6% | -0.5 pp |
| Q3 2025 | 6.8% | -0.7 pp |
| Q2 2025 | 7% | -0.8 pp |
| Q1 2025 | 7.2% | -0.6 pp |
| Q4 2024 | 7.1% | -0.8 pp |
| Q3 2024 | 7.5% | -0.1 pp |
| Q2 2024 | 7.8% | +0.4 pp |
| Q1 2024 | 7.8% | +0.6 pp |
| Q4 2023 | 7.9% | +1 pp |
| Q3 2023 | 7.6% | +0.7 pp |
How to read this series
The source changed how it measures this in Q1 2001. Readings before the March 2001 Call Report are partly estimated by the Federal Reserve rather than reported in full detail. Smaller banks filed the FFIEC 033 and 034 forms and could report charged-off and delinquent loans under their own loan classifications instead of the regulatory ones, so the Federal Reserve adjusted and allocated those amounts to the published loan categories using estimated ratios that differed by loan category. The Board states that from the March 2001 Call Report the detail reported by all banks eliminated the need for those procedures. In February 2017 it updated the models used to estimate data not reported by small banks that filed the FFIEC 034 form and revised the pre-2001 rates for several series, so values on that side of the boundary have already moved once without any new bank report. Readings on either side are not directly comparable, so the year-over-year column stays blank where a comparison would cross that date. Source documentation.
The source changed how it measures this in Q1 2010. From the first quarter of 2010, credit card rates cover loans that banks had securitized and previously kept off their balance sheets. Accounting standards FAS 166 and 167 required banks to bring those loans back on, and the Board states the change is reflected in the 2010-Q1 Call Reports; one large credit card bank made the move in the fourth quarter of 2009. The Board's H.8 notes put the credit card and other revolving loans consolidated by domestically chartered commercial banks at about $335 billion as of March 31, 2010. Rates from 2010 on are measured over a different pool of loans than earlier readings. Readings on either side are not directly comparable, so the year-over-year column stays blank where a comparison would cross that date. Source documentation.
Frequently Asked Questions
What is the credit card delinquency rate at banks outside the top 100?
In Q2 2026, 6.5% of credit card balances at commercial banks outside the 100 largest were 30 or more days past due or in nonaccrual status, down from 7% a year earlier. The Federal Reserve Board publishes it as FRED series DRCCLOBS.
Is this the national credit card delinquency rate?
No. The Fed publishes three size groups: all commercial banks, the 100 largest, and the rest. This is the rest, which holds only a few percent of commercial-bank card loans. The all-bank rate is the national bank figure.
Does the gap with the largest banks mean these banks lend to riskier borrowers?
The Fed does not say. It publishes the rates for each size group but gives no reason for the difference between them, and it does not describe the borrowers behind either rate.
Where does this data come from?
The Federal Reserve Board computes it from the Call Reports that every commercial bank files each quarter and publishes it about two months after the quarter ends, in its Charge-Off and Delinquency Rates on Loans and Leases at Commercial Banks release. FRED republishes it as DRCCLOBS.


Quick poll
Is this affecting you or your household?
Discussion
Get the numbers when they move.
New data drops, indicator updates, and American Distress Index changes — delivered when it matters. No spam.
or Create an Account for full access
Loading comments…