County-Level Food Insecurity Rate
Up from 12.8% a year ago, the worst reading since 2014
What is the current County-Level Food Insecurity Rate?
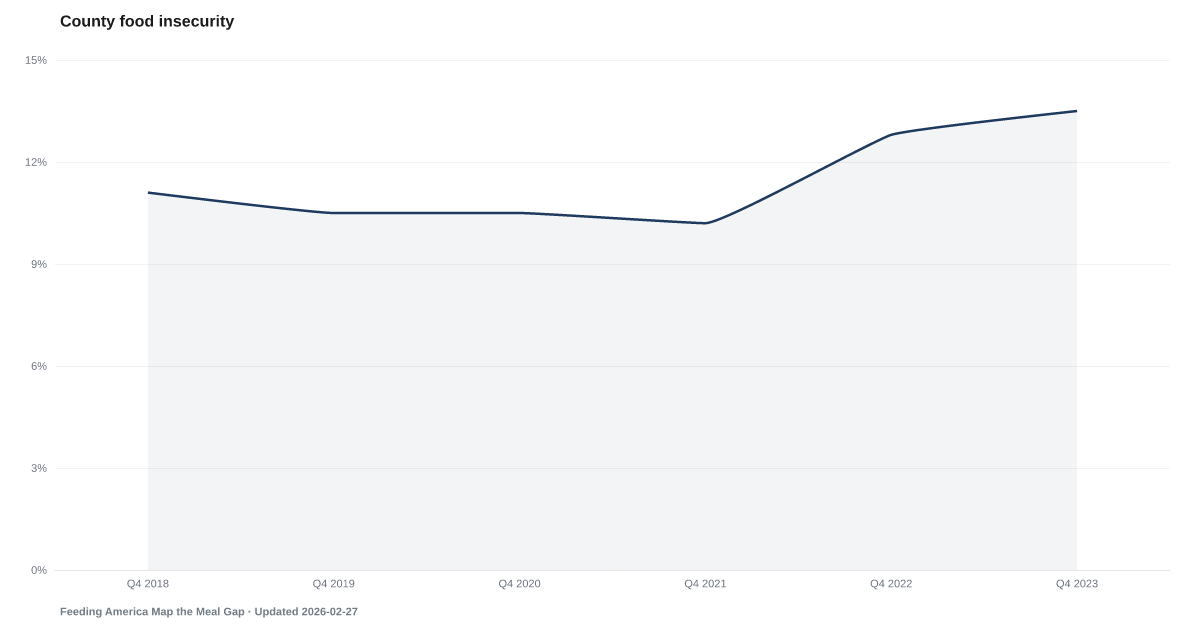
County-Level Food Insecurity Rate: 13.5% as of 2023, and worsening. Source: Feeding America Map the Meal Gap.
The U.S. food insecurity rate rose to 13.5% in 2023. The current reading is the highest in the site series, with a sharp jump from 10.2% two years earlier.
Feeding America's Map the Meal Gap, built on USDA Economic Research Service data, classifies a household as food insecure when it cannot reliably afford enough food for an active, healthy life. In 2023, 13.5% of U.S. households met that definition. That works out to roughly one in seven, including one in five children in the United States.
The jump from 10.2% in 2021 to 13.5% in 2023 is a two-year increase in the site series. It tracks almost perfectly with the rollback of pandemic-era SNAP emergency allotments, which expired for most states in early 2023.
The policy change was the shock. The underlying condition — household budgets that can't absorb a grocery-price increase without something giving — was already in place. SNAP Food Stamp Enrollment remains well above 2019 levels even as headline unemployment stays low. The two indicators describe the same household from different angles.
Food is the most elastic line in a household budget. Rent has to be paid. The car payment has to be paid. Groceries can be cut. When The Squeeze tightens and The Buffer runs dry, this is the indicator that picks up the slack. Note: Feeding America publishes with roughly an 18-month lag, so the most recent calendar year is not yet available.
Explore Further
Is this happening to you?
Have you or someone close to you used a food bank in the past year?
How has County-Level Food Insecurity Rate changed over time?

Most affected counties
Counties with the highest safety net and buffer scores in the County Distress Index.
Explore all 3,144 counties →| Period | Value | YoY Change |
|---|---|---|
| 2023 | 13.5% | +0.7 pts |
| 2022 | 12.8% | +2.6 pts |
| 2021 | 10.2% | −0.3 pts |
| 2020 | 10.5% | +0.0 pts |
| 2019 | 10.5% | −0.6 pts |
| 2018 | 11.1% | — |
Frequently Asked Questions
What is County-Level Food Insecurity Rate?
Up from 12.8% a year ago, the worst reading since 2014
Why does County-Level Food Insecurity Rate matter for financial distress?
County-Level Food Insecurity Rate is one of the indicators tracked by the American Distress Index (ADI), which measures five dimensions of U.S. household financial distress: Delinquency, Default & Legal, Debt Burden, Labor, and Safety Net & Buffer. Changes in this indicator contribute to the overall distress picture.
Where does the County-Level Food Insecurity Rate data come from?
This data comes from Feeding America Map the Meal Gap. More information: https://www.feedingamerica.org/research/map-the-meal-gap. The American Distress Index updates this indicator annual.

Quick poll
Is this affecting you or your household?
Discussion
Get the numbers when they move.
New data drops, indicator updates, and ADI score changes — delivered when it matters. No spam.
or Create an Account for full access
Loading comments…