Youth Unemployment Rate (16-24)
Unemployment rate for workers ages 16 to 24
What is the current Youth Unemployment Rate (16-24) reading?
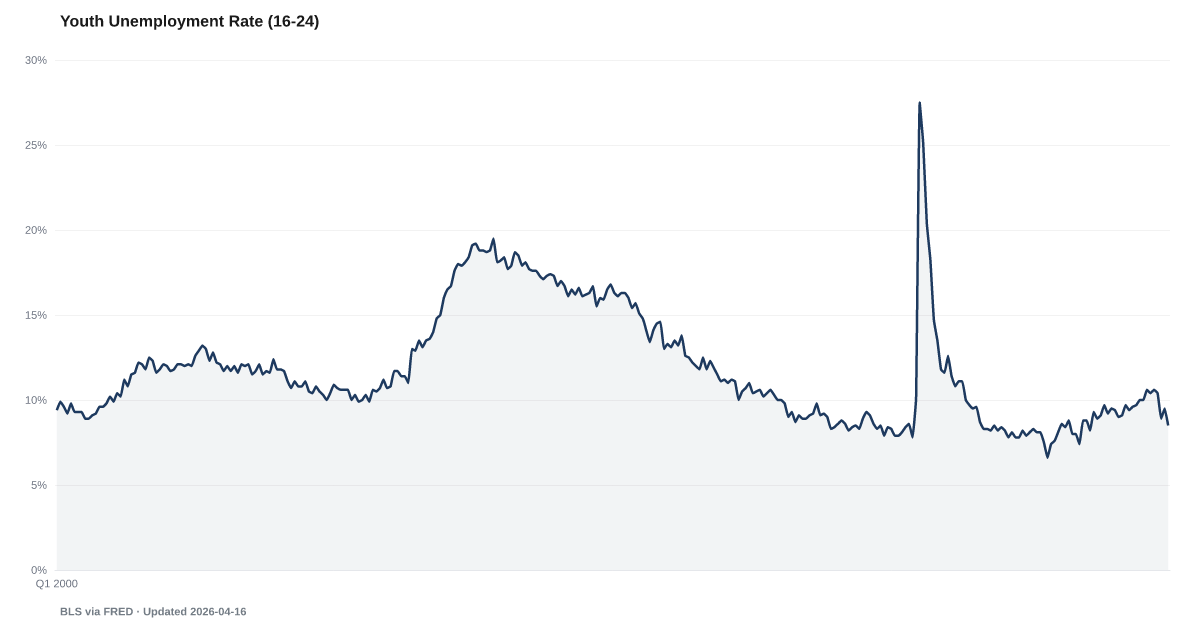
The U.S. unemployment rate for people ages 16 to 24 was 9.1% in August 2026, little changed from 8.5% in July 2026, according to the U.S. Bureau of Labor Statistics. It is the share of young people in the labor force, those working or looking for work, who have no job and are looking or are on temporary layoff. It is not the share of all 16- to 24-year-olds. Source: BLS Current Population Survey data retrieved via FRED (LNS14024887).
Unemployment among workers ages 16 to 24 was 9.1% in August 2026, down from 10.6% a year earlier.
The Bureau of Labor Statistics put the unemployment rate for 16- to 24-year-olds at 9.1% in August 2026. It was 8.5% in July 2026, a one-month move within the survey's margin of error for this age group.
The rate is a share of the 16- to 24-year-old labor force: young people who are working, or who have no job and looked for one in the past four weeks. Students and others who are neither working nor looking are outside it, so the rate is not the share of all young people who lack a job. People waiting to be recalled from a layoff count as unemployed even if they are not looking, and nobody needs to be collecting unemployment benefits to be counted.
Young workers are a small slice of the survey sample, so this rate carries a wider margin of sampling error than the overall rate. For the overall rate, BLS says a one-month change needs to exceed about 0.3 percentage point (points on the percent scale, not a percent of the rate) to stand out from that error. For ages 16 to 24 the margin is wider: by our estimate, about 1 percentage point. Smaller one-month moves are described here as little changed. The survey did not run in October 2025, during the federal government shutdown, so there is no figure for that month.
Comparisons on this page start in 1994. BLS redesigned the survey questionnaire in January 1994, and in its side-by-side test teenagers showed more unemployment under the new questions; in 1967 it changed its definitions and raised the minimum age from 14 to 16. BLS has also said that in March, April and May 2020 some people were counted as employed who probably should have been counted as unemployed, so the rates for those months are likely too low.
This rate covers ages 16 to 24. The teen rate in BLS's monthly news release covers only ages 16 to 19, and the 20-to-24 rate is a separate row in its tables. The Unemployment Rate covers everyone 16 and older, and U-6 Underemployment and Part-Time for Economic Reasons track people the headline rate leaves out.
Explore Further
Is this happening to you?
Do you know a young person struggling to land their first real job?
Youth Unemployment Rate (16-24) over time: what has changed?

Counties with the highest labor scores
These are labor scores from our County Distress Index, not county readings of Youth Unemployment Rate (16-24).
Explore all 3,144 counties →| Period | Value | YoY Change |
|---|---|---|
| Aug 2026 | 9.1% | -1.5 pp |
| Jul 2026 | 8.5% | -1.5 pp |
| Jun 2026 | 9.2% | -0.8 pp |
| May 2026 | 9.4% | -0.3 pp |
| Apr 2026 | 9.5% | -0.1 pp |
| Mar 2026 | 8.5% | -0.9 pp |
| Feb 2026 | 9.5% | -0.2 pp |
| Jan 2026 | 8.9% | -0.2 pp |
| Dec 2025 | 10.4% | +1.4 pp |
| Nov 2025 | 10.6% | +1.2 pp |
| Sep 2025 | 10.4% | +1.2 pp |
| Aug 2025 | 10.6% | +0.9 pp |
How to read this series
The source changed how it measures this in Jan 1967. In 1967 BLS refined its employment and unemployment concepts and raised the lower age limit for official labor force statistics from 14 to 16, so earlier youth rates were not measured the same way. Readings on either side are not directly comparable, so the year-over-year column stays blank where a comparison would cross that date. Source documentation.
The source changed how it measures this in Jan 1994. BLS redesigned the Current Population Survey questionnaire in January 1994; in the parallel test survey teenagers had higher jobless rates than in the official survey, so youth rates before and after are not strictly comparable. Readings on either side are not directly comparable, so the year-over-year column stays blank where a comparison would cross that date. Source documentation.
Frequently Asked Questions
What is the youth unemployment rate now?
BLS's latest reading, for August 2026, is 9.1%. That is lower than a year earlier, when it was 10.6%. The rate is a share of young people who are working or looking for work, not of everyone ages 16 to 24.
Is this the same as the teen unemployment rate?
No. This rate covers ages 16 to 24. The teen rate that BLS reports in its monthly news release covers ages 16 to 19, a narrower group. BLS also publishes a separate rate for ages 20 to 24.
Does this count young people collecting unemployment benefits?
No. The rate comes from survey answers about work and job search. Whether someone is eligible for or receiving unemployment insurance plays no part, and students are classified the same way as everyone else.
Where does youth unemployment data come from?
The Bureau of Labor Statistics estimates it each month from the Current Population Survey, a survey of about 60,000 households that the Census Bureau runs for BLS. It is released with the Employment Situation report, early in the month after the one it describes.


Quick poll
Is this affecting you or your household?
Discussion
Get the numbers when they move.
New data drops, indicator updates, and American Distress Index changes — delivered when it matters. No spam.
or Create an Account for full access
Loading comments…