Cotality Current-to-30-Day Mortgage Transition Rate
Also tracked as First Missed
Transition rate from current to early-stage mortgage delinquency
What is the current Cotality Current-to-30-Day Mortgage Transition Rate reading?
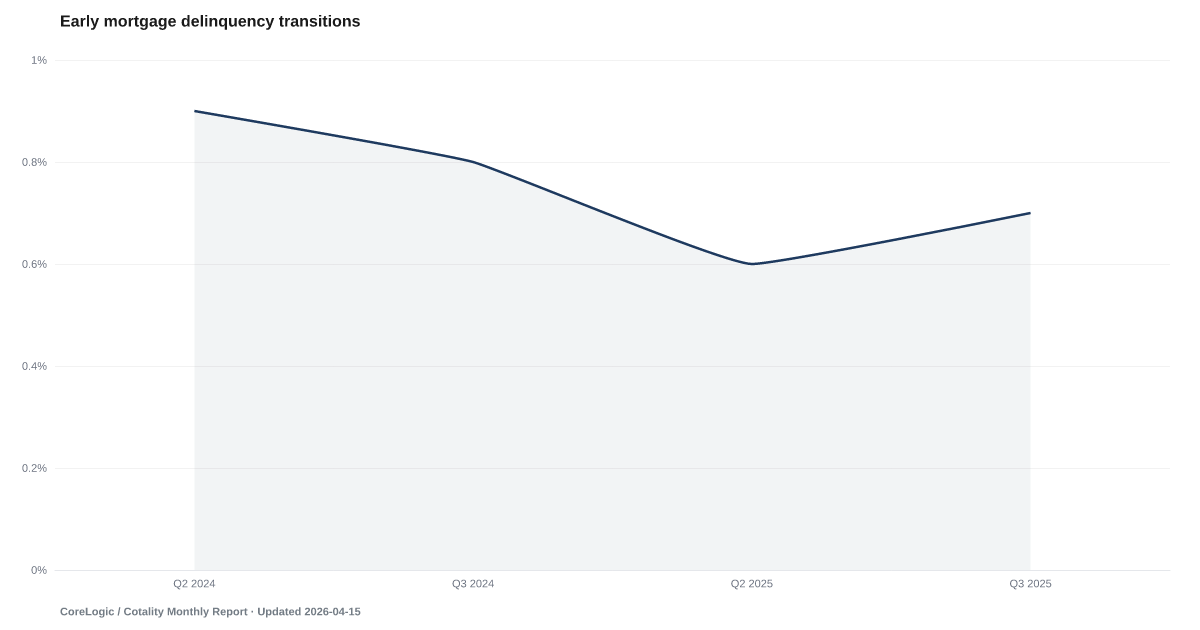
In the last month of Q1 2026, 0.6% of first-lien mortgages in Cotality's data went from current to 30 days past due, the same as a year earlier. It is a one-month flow of loans into early delinquency, not a share of homeowners and not the stock of loans already late. Source: Cotality Loan Performance Insights.
Measurement basis: Share of mortgages that transitioned from current status to 30 days past due during the reported month. This is a flow of mortgages or loans, not the stock already 30–59 days past due and not a share of borrowers.
0.6% of mortgages in Cotality's data went from current to 30 days past due in the last month of Q1 2026, the same as a year earlier.
Every mortgage delinquency starts with one missed payment.
Cotality tracks that first step: the share of first-lien mortgages that were current and went 30 days past due during a single month. It is a flow, not the stock of loans already 30 to 59 days late, and it counts loans, not borrowers. For the last month of Q1 2026 the rate was 0.6%. The rate was the same a year earlier.
Cotality does not say the rate is seasonally adjusted, meaning it may carry regular swings tied to the time of year, and it compares each month with the same month a year earlier. This page does the same. The rate is published to one decimal, so a change of a tenth of a point is at the limit of rounding.
Cotality published this rate every month through at least early 2024. Since mid-2025 it has reported only the last month of each quarter, two to three months after that month ends, and releases have come out later than Cotality announced. The quarter labels on this page mark that final month, not a quarterly average.
Later stages of mortgage trouble are measured separately. Mortgage Delinquency counts bank-held mortgages that are 30 or more days late, and Foreclosure Starts compares foreclosure starts with completions. They come from different sources and cannot stand in for this one.
Explore Further
Is this happening to you?
Did you miss your first mortgage payment recently?
Cotality Current-to-30-Day Mortgage Transition Rate over time: what has changed?

Counties with the highest default and legal scores
These are default and legal scores from our County Distress Index, not county readings of Cotality Current-to-30-Day Mortgage Transition Rate.
Explore all 3,144 counties →| Period | Value | YoY Change |
|---|---|---|
| Q1 2026 | 0.6% | 0 pp |
| Q4 2025 | 0.7% | — |
| Q3 2025 | 0.7% | -0.1 pp |
| Q2 2025 | 0.6% | -0.3 pp |
| Q1 2025 | 0.6% | — |
| Q3 2024 | 0.8% | — |
| Q2 2024 | 0.9% | — |
Frequently Asked Questions
What does the early-stage transition rate measure?
It is the share of first-lien mortgages that went from current to 30 days past due during a single month. Cotality put it at 0.6% for the last month of Q1 2026. Homes owned outright have no mortgage and are not counted.
Is this the share of homeowners who missed a payment?
No. It is a share of first-lien mortgages in Cotality's data, not of homeowners, borrowers or homes. CoreLogic has estimated that about a third of U.S. homes have no mortgage at all, and second mortgages are left out.
How is this different from the mortgage delinquency rate?
A delinquency rate is a stock: all loans that are late at a point in time. This rate is a flow: loans newly moving from current to 30 days late in one month. Cotality publishes both, and one cannot stand in for the other.
Where does this data come from?
Cotality, formerly CoreLogic, publishes it in its Loan Performance Insights report, compiled from public records, contributed loan data and its own analytics. It now reports the last month of each quarter, two to three months after that month ends.


Quick poll
Is this affecting you or your household?
Discussion
Get the numbers when they move.
New data drops, indicator updates, and American Distress Index changes — delivered when it matters. No spam.
or Create an Account for full access
Loading comments…