Mortgage Debt Service Ratio
Scheduled mortgage payments as a share of disposable personal income
What is the current Mortgage Debt Service Ratio reading?
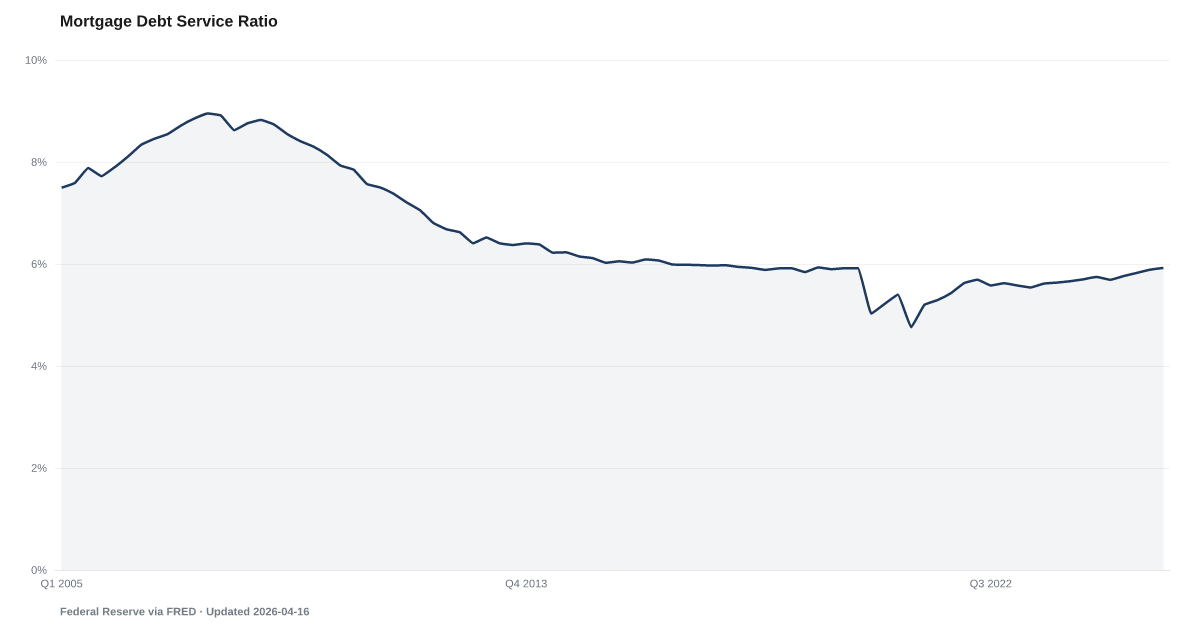
Scheduled mortgage payments equaled 5.8% of U.S. disposable personal income in Q2 2026, according to the Board of Governors of the Federal Reserve System, little changed from 5.9% in Q1 2026. The ratio is the mortgage part of the household debt service ratio: required payments on all open mortgages, including escrowed taxes and insurance, divided by the after-tax income of everyone in the country. Source: Federal Reserve data retrieved via FRED (MDSP).
Scheduled mortgage payments equaled 5.8% of disposable personal income in Q2 2026, little changed from 5.9% in Q1 2026.
The Federal Reserve Board's mortgage debt service ratio compares the mortgage payments households are scheduled to make with the disposable personal income of the whole country. In Q2 2026 it was 5.8%, little changed from 5.9% in Q1 2026. That matches the ratio a year earlier. It is the lowest reading since Q2 2025.
The Board's current method starts in 2005. On that basis the ratio was 9% in Q4 2007, at the end of the housing boom, and 4.8% in Q1 2021, when federal stimulus payments pushed disposable income up. Older published figures, from the method the Board used before 2024, ran lower and cannot be set beside these.
The payment is the scheduled one reported by servicers to a credit bureau, on every open mortgage, including loans taken out years ago. It includes property taxes and insurance only when they are paid through escrow. Payments on loans that are behind count too, so the ratio measures what is owed, not what was missed. Because the income side covers everyone, renters and owners without a mortgage included, it understates the burden on people who have a mortgage. It is not what a buyer would pay on a home bought today.
The ratio moves when either payments or income move, so its direction alone does not say which changed. The Board revises past quarters, sometimes by more than a typical quarterly move, so a change of about a tenth of a point can disappear in a later release. Mortgage payments plus other consumer debt payments make up the Household Debt Service Ratio. Missed payments are tracked in the total delinquency rate.
Explore Further
Mortgage Debt Service Ratio over time: what has changed?

Counties with the highest safety net and buffer scores
These are safety net and buffer scores from our County Distress Index, not county readings of Mortgage Debt Service Ratio.
Explore all 3,144 counties →| Period | Value | YoY Change |
|---|---|---|
| Q2 2026 | 5.8% | 0 pp |
| Q1 2026 | 5.9% | +0.1 pp |
| Q4 2025 | 5.9% | +0.2 pp |
| Q3 2025 | 5.9% | +0.2 pp |
| Q2 2025 | 5.8% | +0.1 pp |
| Q1 2025 | 5.8% | +0.1 pp |
| Q4 2024 | 5.7% | +0.1 pp |
| Q3 2024 | 5.7% | +0.1 pp |
| Q2 2024 | 5.7% | +0.2 pp |
| Q1 2024 | 5.7% | +0.1 pp |
| Q4 2023 | 5.6% | 0 pp |
| Q3 2023 | 5.6% | 0 pp |
Frequently Asked Questions
What is the mortgage debt service ratio?
It is scheduled mortgage payments as a share of disposable personal income, the after-tax income of everyone in the national accounts. It was 5.8% in Q2 2026, little changed from 5.9% in Q1 2026.
Does it show what homeowners pay for their mortgage?
No. It divides all mortgage payments by the income of everyone, including renters and owners without a mortgage, so it is lower than the share of income people with a mortgage pay. It also covers every open loan, not the payment on a home bought today.
Why track mortgage debt service separately?
The Board splits the household debt service ratio into two parts, mortgage and consumer debt, and the two add up to the total. Tracking the mortgage part on its own shows how much of scheduled debt payments goes to housing loans.
Where does this data come from?
The Federal Reserve Board publishes the ratio quarterly, on no fixed day, as part of its household debt service ratios. It reads scheduled payments from a random sample of credit records and divides them by disposable personal income from the national accounts. It is on FRED as MDSP.


Quick poll
Is this affecting you or your household?
Discussion
Get the numbers when they move.
New data drops, indicator updates, and American Distress Index changes — delivered when it matters. No spam.
or Create an Account for full access
Loading comments…