Prescription Drug CPI
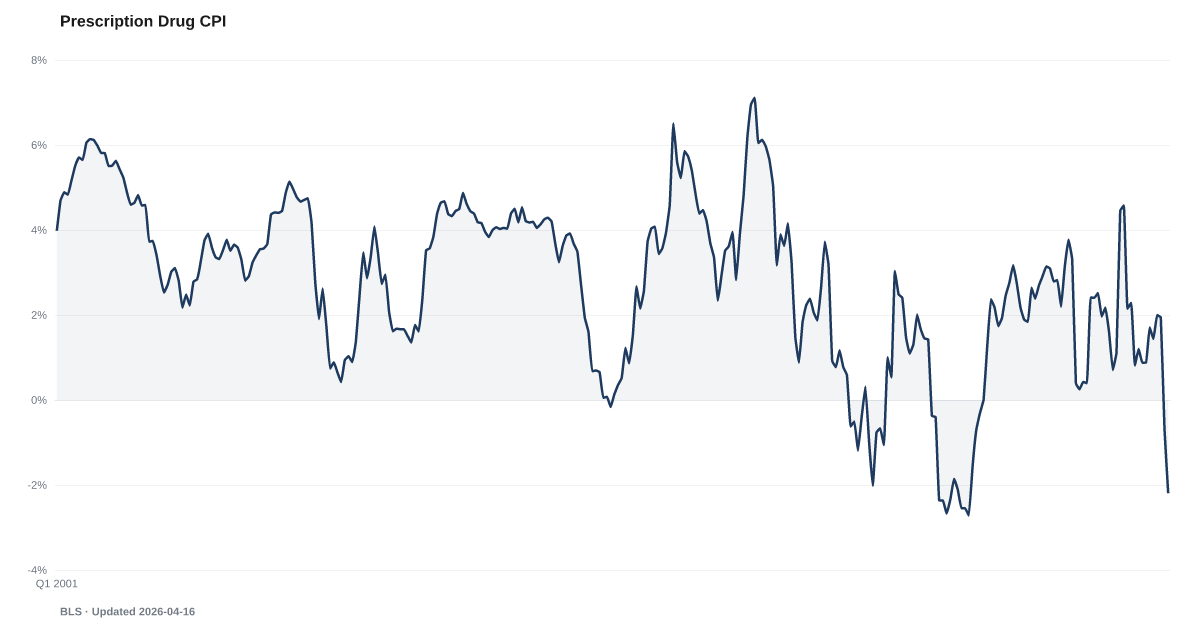
Year-over-year change in prescription drug prices
What is the current Prescription Drug CPI reading?
In the U.S. Bureau of Labor Statistics consumer price index, prescription drug prices were 2.9% lower than a year earlier in August 2026, down from a 12-month change of 0.9% in August 2025. The index tracks the total a pharmacy is paid for a prescription, copay and insurer share together, for urban consumers. It is not out-of-pocket cost and not a manufacturer list price. Source: BLS CPI prescription drugs (CUSR0000SEMF01).
Measurement basis: Year-over-year percent change in the BLS prescription drug CPI, series CUSR0000SEMF01. BLS has published prescription drugs as not seasonally adjusted since its 2022 review, and this series' values equal the unadjusted index from January 2017; earlier values are seasonally adjusted.
Over the 12 months to August 2026, prescription drug prices in the Bureau of Labor Statistics consumer price index went down 2.9%.
The Bureau of Labor Statistics prices a sample of filled prescriptions at retail, mail-order and online pharmacies. In August 2026 those prices were 2.9% lower than a year earlier. The 12-month change is down from 0.9% in August 2025. A month earlier, in July 2026, the 12-month change was -3.1%.
The 12-month change has been below its year-earlier level for eight months in a row.
A change below zero means prescriptions cost less than they did a year earlier.
The price BLS tracks is the total the pharmacy receives: the patient's copay plus what the insurer or Medicare Part D plan pays. It is not what a patient pays at the counter, and manufacturer rebates are not subtracted. When a brand-name drug loses its patent and a generic is priced in its place, the difference counts as a price change. Prescriptions paid by Medicaid and drugs given in hospitals are outside the index. Medical Care CPI covers the wider medical basket.
Negotiated Medicare prices for 10 Part D drugs took effect on January 1, 2026. BLS does not attribute the index's moves to any cause, and the index mixes cash, commercial and Part D prescriptions, so the timing alone does not show what drove a change. BLS has published this index not seasonally adjusted since 2022, and it changed the index formula in 2016, so comparisons with earlier years span a method change. There is no figure for October 2025, when the federal government shutdown stopped data collection.
Explore Further
Prescription Drug CPI over time: what has changed?

Counties with the highest debt burden scores
These are debt burden scores from our County Distress Index, not county readings of Prescription Drug CPI.
Explore all 3,144 counties →| Period | Value | YoY Change |
|---|---|---|
| Aug 2026 | -2.9% | -3.8 pp |
| Jul 2026 | -3.1% | -4 pp |
| Jun 2026 | -2.5% | -3.7 pp |
| May 2026 | -2% | -2.8 pp |
| Apr 2026 | -0.5% | -2.8 pp |
| Mar 2026 | -0.2% | -2.3 pp |
| Feb 2026 | -0.7% | -5.3 pp |
| Jan 2026 | -0.5% | -5 pp |
| Dec 2025 | 2% | +0.9 pp |
| Nov 2025 | 1.9% | +1.2 pp |
| Sep 2025 | 1.7% | -0.5 pp |
| Aug 2025 | 0.9% | -1.1 pp |
Frequently Asked Questions
Are prescription drug prices going up or down?
In August 2026, the BLS prescription drug index stood 2.9% below its level a year earlier. A month earlier, in July 2026, the 12-month change was -3.1%. The index is published not seasonally adjusted, so BLS's own 12-month figure and ours match.
Does this show what I pay at the pharmacy?
No. The tracked price is the whole payment to the pharmacy, the copay plus the insurer's or Part D plan's share. A copay can stay the same while the index moves, and the reverse. It is also not a manufacturer's list price, which is measured in a separate producer price index.
Where does prescription drug CPI data come from?
The Bureau of Labor Statistics publishes the index every month in its consumer price index report, between the 10th and 14th of the following month. BLS combines prices collected at sampled pharmacies with price data from one large firm. The index is a U.S. city average; BLS does not publish it for states or counties.


Quick poll
Is this affecting you or your household?
Discussion
Get the numbers when they move.
New data drops, indicator updates, and American Distress Index changes — delivered when it matters. No spam.
or Create an Account for full access
Loading comments…