The Buffer
Personal savings rate as share of disposable income
What is the current The Buffer?
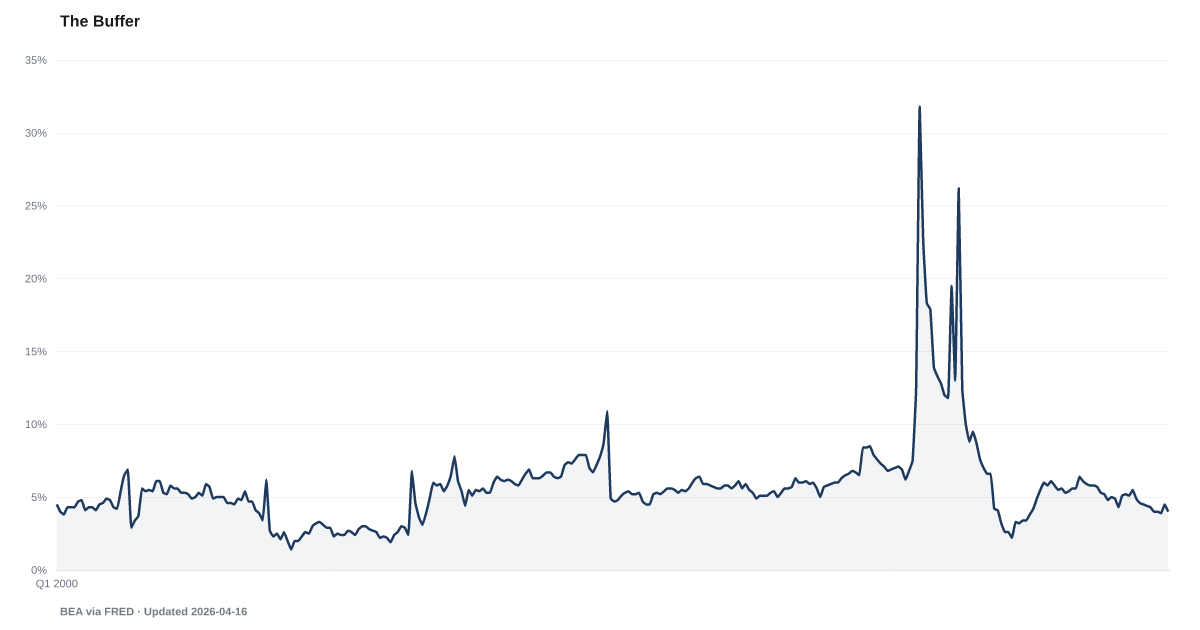
The U.S. personal savings rate was 2.6% of disposable income in April 2026, down from 5.1% a year earlier, according to the Bureau of Economic Analysis. This is well below the 7.5% pre-pandemic average and below the 5–7% range economists consider a healthy buffer against financial shocks. The savings rate feeds the American Distress Index's Safety Net & Buffer domain, one of five equal-weighted domains, and validated research shows savings rate declines precede loan delinquency spikes by 9 quarters. Source: BEA via FRED (PSAVERT).
The national savings rate has fallen to a level that historically precedes significant increases in loan delinquency.
Americans saved just 2.6% of disposable personal income in April 2026, according to the Bureau of Economic Analysis — well below the 5–7% range economists consider healthy and below the roughly 6.5% average from the three years leading into the pandemic. Pandemic-era excess savings are fully exhausted.
When the savings rate drops this low, the effects cascade through every measure of household financial health. The Safety Net shows that only a minority of Americans could handle a $1,000 emergency from savings. The Cannibalization Rate reveals that 401(k) hardship-withdrawal rates have risen well above their 2019 rate. The macro savings rate and the micro household surveys are telling the same story.
Historically, this is a leading indicator. During the 2005–2007 period, the savings rate fell below 3% — over two years before mortgage delinquencies spiked in the financial crisis. Debt Service shows household debt payments consuming a growing share of disposable income and climbing. With savings depleted and debt service rising, the margin for error has all but disappeared.
Explore Further
Is this happening to you?
How many months of expenses could you cover if your income stopped tomorrow?
How has The Buffer changed over time?

Most affected counties
Counties with the highest safety net and buffer scores in the County Distress Index.
Explore all 3,144 counties →| Period | Value | YoY Change |
|---|---|---|
| Apr 2026 | 2.6% | −2.9 pts |
| Mar 2026 | 3.2% | −1.9 pts |
| Feb 2026 | 3.6% | −1.6 pts |
| Jan 2026 | 4.3% | −0.8 pts |
| Dec 2025 | 3.6% | −0.7 pts |
| Nov 2025 | 3.8% | −1.1 pts |
| Oct 2025 | 3.9% | −1.1 pts |
| Sep 2025 | 4.3% | −0.5 pts |
| Aug 2025 | 4.4% | −0.8 pts |
| Jul 2025 | 4.5% | −0.8 pts |
| Jun 2025 | 4.6% | −1.1 pts |
| May 2025 | 4.9% | −0.9 pts |
Frequently Asked Questions
What is the current U.S. personal savings rate?
The U.S. personal savings rate was 2.6% of disposable income in April 2026, according to the Bureau of Economic Analysis. This is down from 5.1% a year earlier and well below the 7.5% pre-pandemic average.
Why does the personal savings rate matter for financial distress?
The savings rate is the cushion between a bad month and a missed payment. It is the sole input to the American Distress Index's Safety Net & Buffer domain, one of five equal-weighted domains, scored against its own quarterly history since 2005. When savings sit low in their own record, households have less room to absorb a shock before bills go unpaid.
What is a healthy personal savings rate?
Economists generally consider a personal savings rate of 5–7% of disposable income to be a healthy baseline. The pre-pandemic (2015–2019) average was approximately 7.5%. Rates below 4% have historically been associated with elevated household financial vulnerability and preceded the 2008 financial crisis.
How is the personal savings rate used in the American Distress Index?
The personal savings rate is the sole member of the American Distress Index's Safety Net & Buffer domain, one of five equal-weighted domains. Each quarter is scored as a percentile of the series' own full quarterly history, inverted so that a lower savings rate reads as higher distress. The domain enters the composite at equal weight with Delinquency, Default & Legal, Debt Burden, and Labor.
Where does the personal savings rate data come from?
The personal savings rate is published monthly by the Bureau of Economic Analysis (BEA) as part of the Personal Income and Outlays report. American Default tracks it via the FRED series PSAVERT. Data is typically released with a one-month lag.

Quick poll
Is this affecting you or your household?
Discussion
Get the numbers when they move.
New data drops, indicator updates, and ADI score changes — delivered when it matters. No spam.
or Create an Account for full access
Loading comments…