The Tightening
Chicago Fed measure of non-financial leverage conditions
What is the current The Tightening?
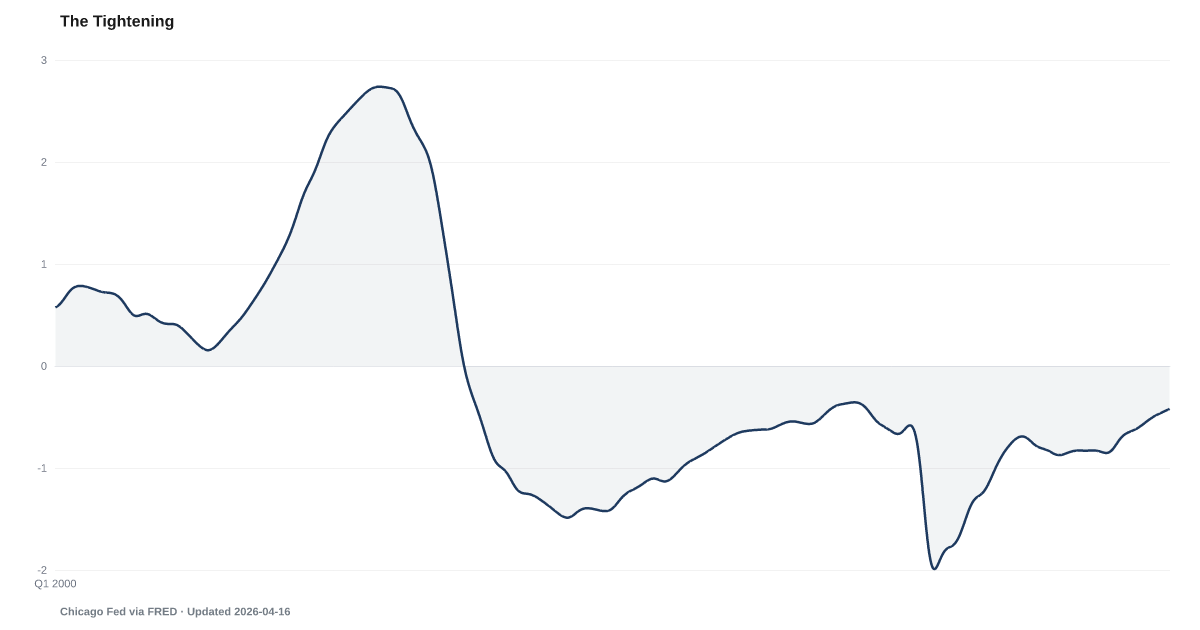
The Chicago Fed's NFCI Non-Financial Leverage Subindex stood at -0.4 in June 2026, up from -0.86 in late 2023 — a sharp tightening from the post-pandemic loose-conditions trough. In this index, zero represents average historical conditions, with negative values indicating relatively loose conditions and positive values indicating tightening. The current trajectory mirrors the early stages of the pre-2008 build-up. Source: Federal Reserve Bank of Chicago.
Financial leverage conditions are tightening quickly by recent standards, moving steadily toward levels that have historically preceded credit stress.
The Chicago Fed's NFCI Non-Financial Leverage Subindex reads -0.4 as of June 2026, up from -0.86 in late 2023. In this index, zero represents average historical conditions and positive values indicate tighter-than-average leverage. The current reading is still negative — meaning conditions are technically looser than the historical average — but the speed and direction of the move matters more than the absolute level. The index has risen substantially since its recent low.
Leverage tightening means that borrowing is becoming harder and more expensive across the economy. This confirms what individual indicators already show: The Card Tax still elevated, The Warning Light sitting below its recession threshold for over a year, and The Mood Ring at levels not seen outside of recessions. The NFCI provides a single composite measure that integrates dozens of market-based signals into one directional reading.
In the pre-GFC period, this index rose from roughly -0.9 in 2003 to +2.7 in 2007, spending years above zero before the crisis hit. In the current cycle, it's rising from -0.86 but has not yet crossed zero. Debt Service as a share of disposable income is already at levels suggesting households are feeling the effects of tighter conditions before the index reaches its stress threshold.
Explore Further
Is this happening to you?
Have you noticed higher interest rates or tighter credit terms on your accounts?
How has The Tightening changed over time?

Most affected counties
Counties with the highest debt burden scores in the County Distress Index.
Explore all 3,144 counties →| Period | Value | YoY Change |
|---|---|---|
| Jun 2026 | -0.39 | +0.24 |
| May 2026 | -0.39 | +0.24 |
| May 2026 | -0.4 | +0.24 |
| May 2026 | -0.4 | +0.24 |
| May 2026 | -0.41 | +0.24 |
| May 2026 | -0.41 | +0.24 |
| Apr 2026 | -0.41 | +0.24 |
| Apr 2026 | -0.42 | +0.24 |
| Apr 2026 | -0.42 | +0.24 |
| Apr 2026 | -0.42 | +0.24 |
| Mar 2026 | -0.43 | +0.24 |
| Mar 2026 | -0.43 | +0.24 |
Frequently Asked Questions
What does the NFCI leverage subindex measure?
The Chicago Fed's National Financial Conditions Index (NFCI) leverage subindex measures non-financial sector leverage conditions. Zero represents average historical conditions, negative values indicate looser conditions, positive values indicate tighter conditions.
Are financial conditions tightening?
Yes. The index has risen from -0.86 in late 2023 to -0.4 in June 2026 — marking a sharp reversal from the post-pandemic loose-conditions trough. While still technically negative, the direction matters more than the level.
How does the current reading compare to the 2008 crisis?
In the pre-2008 period, this index rose from roughly -0.9 in 2003 to +2.7 in 2007, spending years above zero before the crisis. The current index at -0.4 (June 2026) has not yet crossed zero but is moving in that direction.
What does tightening mean for households?
Tightening leverage conditions mean that borrowing becomes harder and more expensive. This shows up in individual indicators: record credit card APRs, rising delinquency across loan types, and stricter underwriting at small banks.
Where does the NFCI data come from?
The Chicago Fed publishes the National Financial Conditions Index weekly, incorporating over 100 measures of financial activity across money markets, debt markets, equity markets, and the banking system.

Quick poll
Is this affecting you or your household?
Discussion
Get the numbers when they move.
New data drops, indicator updates, and ADI score changes — delivered when it matters. No spam.
or Create an Account for full access
Loading comments…