Total Household Debt
Total outstanding U.S. household debt
What is the current Total Household Debt reading?
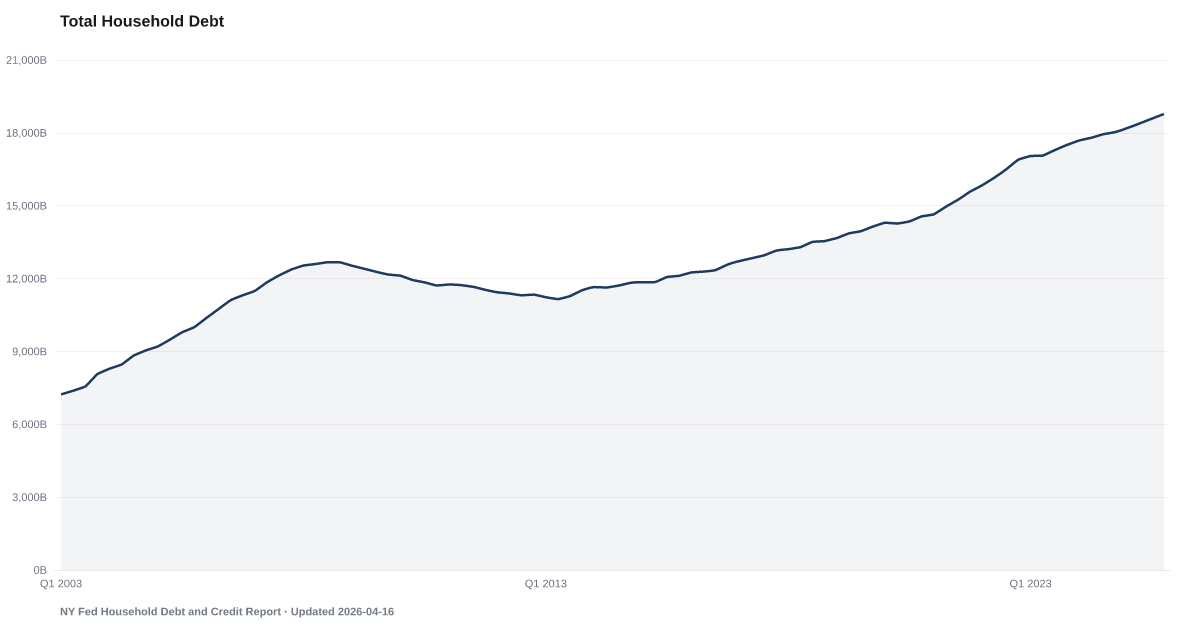
People in the U.S. with a credit report owed $18.77 trillion in total household debt in Q2 2026, according to the New York Fed's Household Debt and Credit Report, up from $18.39 trillion a year earlier. The total covers mortgages, home equity lines, auto loans, credit cards, student loans and other consumer loans. Source: Federal Reserve Bank of New York Household Debt and Credit Report (Q2 2026).
Total U.S. household debt was $18.77 trillion in Q2 2026, up $382.5 billion from a year earlier.
The New York Fed's Household Debt and Credit Report put the total at $18.77 trillion in Q2 2026, up $382.5 billion from $18.39 trillion a year earlier. It was $13.5 billion lower than in Q1 2026. The New York Fed does not say this total is seasonally adjusted, so a move from one quarter to the next can reflect seasonal patterns and reporting changes as well as repayment.
The total has been higher than a year earlier for 51 quarters in a row.
The newest quarter can be revised at the next release.
The total adds up the balances on mortgages, home equity lines of credit, auto loans and leases, credit cards, student loans and other consumer loans on the Equifax credit reports of people with a Social Security number. Mortgages are the largest part. Accounts in bankruptcy and medical bills are left out. It is what people owe at the end of the quarter, not new borrowing, and it is in current dollars.
The Federal Reserve's Financial Accounts publish a larger household debt figure that also counts nonprofit organizations and is seasonally adjusted. It is a different measure, and in some quarters the two go in opposite directions, so always say which one you mean.
A dollar total alone does not say whether debt is hard to carry. The total delinquency rate tracks the share of these balances that are behind on payments, the personal saving rate tracks how much of their income households save, and a Bankrate survey records how adults say they would pay for an emergency. These separate measures do not show why debt changed.
Explore Further
Total Household Debt over time: what has changed?

Counties with the highest safety net and buffer scores
These are safety net and buffer scores from our County Distress Index, not county readings of Total Household Debt.
Explore all 3,144 counties →| Period | Value | YoY Change |
|---|---|---|
| Q2 2026 | $18.77T | +$0.38T |
| Q1 2026 | $18.78T | +$0.58T |
| Q4 2025 | $18.78T | +$0.74T |
| Q3 2025 | $18.58T | +$0.64T |
| Q2 2025 | $18.39T | +$0.59T |
| Q1 2025 | $18.2T | +$0.51T |
| Q4 2024 | $18.04T | +$0.54T |
| Q3 2024 | $17.94T | +$0.65T |
| Q2 2024 | $17.8T | +$0.74T |
| Q1 2024 | $17.69T | +$0.64T |
| Q4 2023 | $17.5T | +$0.6T |
| Q3 2023 | $17.29T | +$0.78T |
Frequently Asked Questions
How much debt do U.S. households owe?
The New York Fed puts total household debt at $18.77 trillion for Q2 2026, up from $18.39 trillion a year earlier. Mortgages are the largest part; credit cards, auto loans, student loans, home equity lines and other loans make up the rest.
Is household debt at a record high?
Not in the latest quarter. Of 94 quarters since 2003, it ranks third highest in dollar terms. A record in dollars says little by itself, because prices, incomes and the population all grow over time.
Is this the same as the Federal Reserve's household debt number?
No. The Fed's Financial Accounts count households and nonprofit organizations together and are seasonally adjusted, so their total is larger and can move differently in a given quarter. The New York Fed says its figures line up with two parts of that series, home mortgages and consumer credit.
Where does household debt data come from?
The New York Fed's Quarterly Report on Household Debt and Credit, built from the New York Fed Consumer Credit Panel, a nationally representative random sample of Equifax credit reports. It comes out about five to six weeks after each quarter ends.


Quick poll
Is this affecting you or your household?
Discussion
Get the numbers when they move.
New data drops, indicator updates, and American Distress Index changes — delivered when it matters. No spam.
or Create an Account for full access
Loading comments…