HELOC Balance Growth
Total outstanding balance on home equity lines of credit
What is the current HELOC Balance Growth?
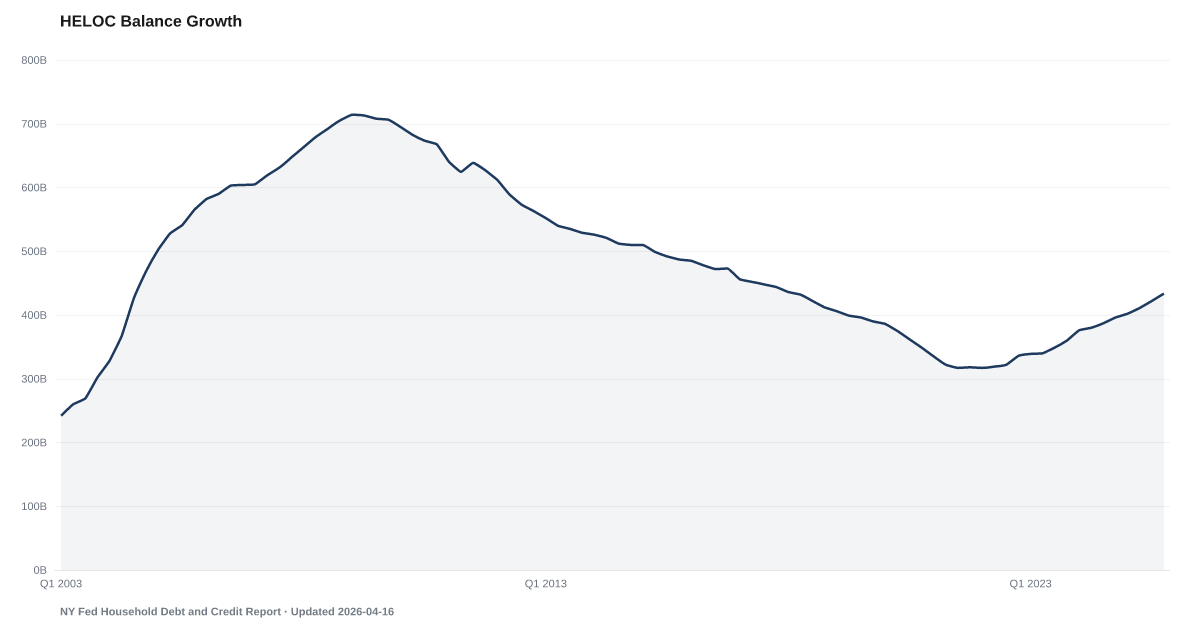
HELOC Balance Growth: $433.6B as of 2025-Q4, and worsening. Source: NY Fed Household Debt and Credit Report.
Home equity lines of credit have climbed every quarter since Q2 2022 (through Q4 2025). The longest sustained increase since the run-up to 2007.
The New York Fed's Household Debt and Credit Report tracks HELOC balances back to 2003. After the 2008 financial crisis, balances fell for more than a decade, bottoming at $317 billion in late 2021 as homeowners paid down credit lines or let them expire. The trend has reversed. Balances have risen every quarter since Q2 2022, reaching $433.6B in Q4 2025.
The timing tells the story. Home prices have kept rising through the current cycle. Households that bought or refinanced during the 2020-2021 window are sitting on sub-4% mortgages they would be crazy to refinance. A HELOC is the workaround — access the equity without touching the first mortgage.
The last time HELOC balances accelerated like this was 2004 to 2007. That is not a reassuring comparison. Cash-out refinancing is suppressed by rate lock-in, so the equity tap is flowing through HELOCs instead — and in practice, the money is funding consumption, not investment. Home Depot's CFO has called it out. Auto dealers have noticed. The pattern is visible.
Equity extraction tends to accelerate when other funding sources are closing down. The Buffer is near historic lows. The Safety Net covers fewer households than in Bankrate's survey history. When savings run out and credit cards are maxed, the last line of defense is the house. That line is now being drawn on through HELOCs.
Explore Further
How has HELOC Balance Growth changed over time?

Most affected counties
Counties with the highest safety net and buffer scores in the County Distress Index.
Explore all 3,144 counties →| Period | Value | YoY Change |
|---|---|---|
| Q4 2025 | $433.6B | +$37.6B |
| Q3 2025 | $422B | +$35.0B |
| Q2 2025 | $411B | +$31.0B |
| Q1 2025 | $402B | +$26.0B |
| Q4 2024 | $396B | +$36.0B |
| Q3 2024 | $387B | +$38.0B |
| Q2 2024 | $380B | +$40.0B |
| Q1 2024 | $376B | +$37.0B |
| Q4 2023 | $360B | +$24.0B |
| Q3 2023 | $349B | +$27.0B |
| Q2 2023 | $340B | +$21.0B |
| Q1 2023 | $339B | +$22.0B |
Frequently Asked Questions
What is HELOC Balance Growth?
Total outstanding balance on home equity lines of credit
Why does HELOC Balance Growth matter for financial distress?
HELOC Balance Growth is one of the indicators tracked by the American Distress Index (ADI), which measures five dimensions of U.S. household financial distress: Delinquency, Default & Legal, Debt Burden, Labor, and Safety Net & Buffer. Changes in this indicator contribute to the overall distress picture.
Where does the HELOC Balance Growth data come from?
This data comes from NY Fed Household Debt and Credit Report. More information: https://www.newyorkfed.org/microeconomics/hhdc. The American Distress Index updates this indicator quarterly.

Quick poll
Is this affecting you or your household?
Discussion
Get the numbers when they move.
New data drops, indicator updates, and ADI score changes — delivered when it matters. No spam.
or Create an Account for full access
Loading comments…