Mortgage Origination Volume
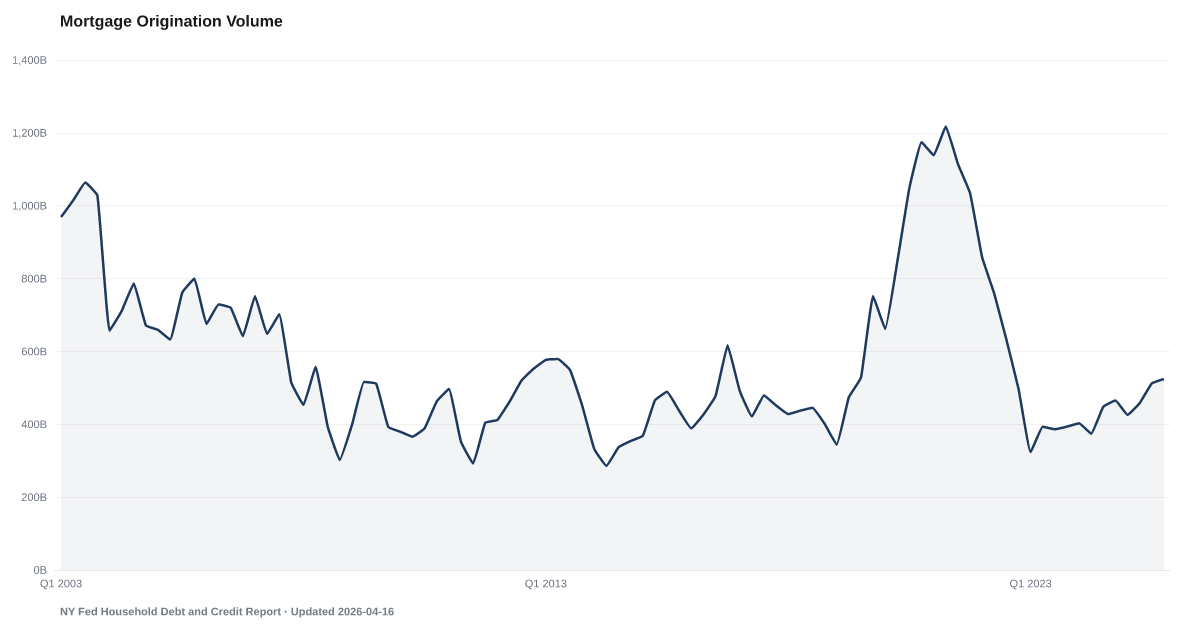
Quarterly dollar volume of new mortgage originations
What is the current Mortgage Origination Volume reading?
New mortgages worth $504.6 billion first appeared on U.S. credit reports in Q2 2026, according to the New York Fed, up from $458.3 billion a year earlier. The total counts purchase loans and refinances in current dollars. It is one quarter's new lending, not total mortgage debt. Source: Federal Reserve Bank of New York Quarterly Report on Household Debt and Credit.
$504.6 billion in new mortgages first appeared on credit reports in Q2 2026, up from $458.3 billion a year earlier.
The New York Fed counts the dollars of new mortgages, both home purchase loans and refinances, as they first show up on people's credit reports. In Q2 2026 the total was $504.6 billion, up from $458.3 billion in Q2 2025. It was smaller than in Q1 2026, the quarter before; the series is not seasonally adjusted, so part of a quarter-to-quarter move is the time of year.
That is the smallest quarterly total since Q2 2025, when it was $458.3 billion. New lending has been larger than a year earlier for eight quarters in a row.
For scale, $1.22 trillion in new mortgages appeared on credit reports in Q2 2021 alone, during the refinancing wave when 30-year mortgage rates were below 3%.
These are dollars, not a count of loans or buyers, and they are gross: when a homeowner refinances, the new loan is added here and the old one is not subtracted. So this measures new lending, not how much mortgage debt people owe. It includes closed-end home equity loans but not home equity lines of credit. The dollars are not adjusted for inflation, so older totals and newer ones are not on the same footing.
This page does not say why lending moves. For what happens to mortgages after they are made, see Cotality's early delinquency rate, the share of mortgages that go from current to 30 days late, and Mortgage Delinquency for loans held by banks. Total household borrowing is on Total Household Debt.
Explore Further
Is this happening to you?
Are you thinking about buying or refinancing?
Mortgage Origination Volume over time: what has changed?

Counties with the highest delinquency scores
These are delinquency scores from our County Distress Index, not county readings of Mortgage Origination Volume.
Explore all 3,144 counties →| Period | Value | YoY Change |
|---|---|---|
| Q2 2026 | $504.6B | +$46.3B |
| Q1 2026 | $529.8B | +$104.2B |
| Q4 2025 | $524.4B | +$59.1B |
| Q3 2025 | $512.2B | +$63.9B |
| Q2 2025 | $458.3B | +$84.2B |
| Q1 2025 | $425.6B | +$22.9B |
| Q4 2024 | $465.3B | +$71.5B |
| Q3 2024 | $448.3B | +$61.9B |
| Q2 2024 | $374.1B | -$19.3B |
| Q1 2024 | $402.7B | +$79.2B |
| Q4 2023 | $393.8B | -$103.8B |
| Q3 2023 | $386.4B | -$246.1B |
Frequently Asked Questions
How much in new mortgages is being originated?
The New York Fed counted $504.6 billion for Q2 2026, up from $458.3 billion in Q2 2025. That covers purchase loans, refinances and closed-end home equity loans, dated by when they first appear on a credit report rather than when they closed.
Is this how much mortgage debt Americans owe?
No. It is a single quarter's new loans. Outstanding mortgage balances are a far larger stock, and a refinance adds a new loan here even though it pays off an old one.
Is mortgage origination volume at a record?
No. Of 94 quarters since 2003, it ranks 46th largest, in dollars not adjusted for inflation.
Where does this data come from?
The New York Fed's Quarterly Report on Household Debt and Credit, built from its Consumer Credit Panel, a random sample of anonymized Equifax credit reports scaled up to the nation. It comes out about six weeks after each quarter ends.


Quick poll
Is this affecting you or your household?
Discussion
Get the numbers when they move.
New data drops, indicator updates, and American Distress Index changes — delivered when it matters. No spam.
or Create an Account for full access
Loading comments…