Motor Vehicle Insurance CPI
Year-over-year change in auto insurance premiums
Historically follows CPI Inflation Rate (All Items) by 3 quarters — no active signal. CPI Inflation Rate (All Items) · View projections
What is the current Motor Vehicle Insurance CPI?
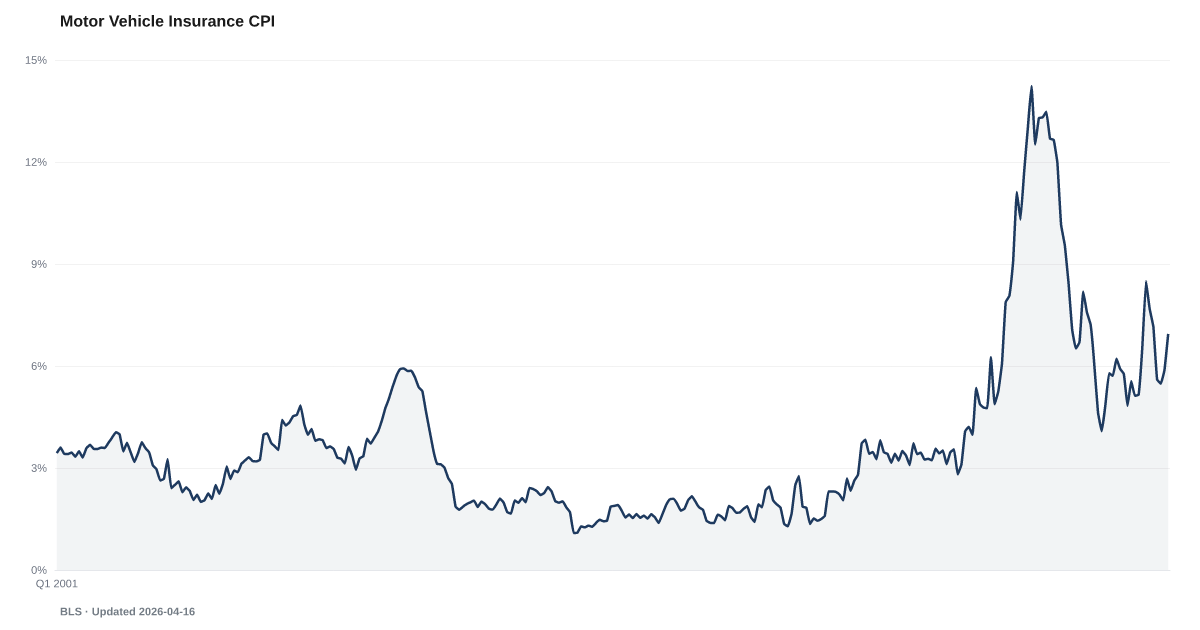
Motor vehicle insurance prices rose 6.1% year-over-year in May 2026, according to BLS CPI data (series CUSR0000SETD). While well below the 19.8% peak reached in June 2023, auto insurance inflation continues to outpace overall consumer prices. Source: BLS Consumer Price Index.
Auto insurance inflation is running at 6.1% year-over-year. Still well above the overall CPI rate and several times the pre-pandemic norm.
Before the pandemic, auto insurance inflation typically ran between 1 and 3 percent a year. Predictable. Slow. A routine feature of driving in America.
BLS data shows it at 6.1% in May 2026. The series reached its all-time high of 14.2% in January 2023; current 6.1% has not exceeded that peak, while auto insurance inflation is still running at several times the pre-pandemic norm. Cumulative auto insurance prices remain far above 2020 levels.
The drivers are structural. Vehicles are more expensive to repair because they contain more sensors and electronics. Medical costs for injury claims continue climbing. Litigation and claim severity are both elevated. None of these reverse easily. The rate has cooled from its shock level, but the underlying cost base has not.
For households, insurance is required to drive legally. That makes it one of the hardest line items to trim when budgets tighten. The Repo Line shows auto loan serious delinquency continuing to climb. Households are keeping the car running, borrowing against the wire, and then losing it. The insurance surcharge is part of what pushes them there.
Explore Further
How has Motor Vehicle Insurance CPI changed over time?

Most affected counties
Counties with the highest debt burden scores in the County Distress Index.
Explore all 3,144 counties →| Period | Value | YoY Change |
|---|---|---|
| May 2026 | 6.13% | +1.0 pts |
| Apr 2026 | 5.15% | −0.4 pts |
| Mar 2026 | 6.05% | +1.2 pts |
| Feb 2026 | 5.62% | −0.2 pts |
| Jan 2026 | 4.95% | −1.0 pts |
| Dec 2025 | 5.38% | −0.8 pts |
| Nov 2025 | 6.94% | +1.2 pts |
| Sep 2025 | 7.68% | +2.8 pts |
| Aug 2025 | 8.5% | +4.4 pts |
| Jul 2025 | 6.54% | +1.9 pts |
| Jun 2025 | 5.15% | −0.9 pts |
| May 2025 | 5.12% | −2.1 pts |
Frequently Asked Questions
How much has auto insurance gone up?
Motor vehicle insurance prices rose 6.1% year-over-year in May 2026 (BLS series CUSR0000SETD). From the 19.8% peak in June 2023, the rate has declined but remains well above the long-run average.
Why is auto insurance so expensive?
Three factors drive elevated auto insurance costs: higher vehicle repair costs (parts inflation + labor shortages), increased claim severity (more expensive vehicles, advanced sensors), and higher reinsurance costs after years of catastrophic weather losses.
How does auto insurance inflation connect to the American Distress Index?
Auto insurance CPI is not an input to the American Distress Index. American Default Research tracks it as context: it illustrates the gap between headline CPI and the costs households actually face.

Quick poll
Is this affecting you or your household?
Discussion
Get the numbers when they move.
New data drops, indicator updates, and ADI score changes — delivered when it matters. No spam.
or Create an Account for full access
Loading comments…