Adults Who Paid Less or Skipped Bills
Also tracked as The Skip Rate
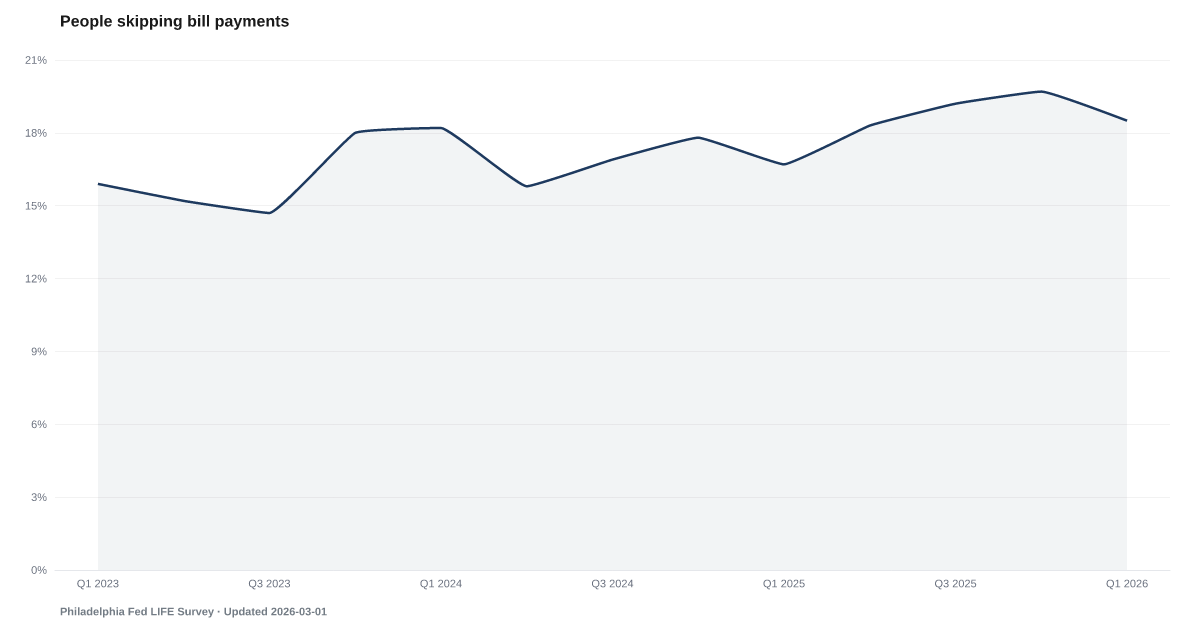
18.3% of adults, about the same as the 19.2% of Q3 2025; each reading covers the prior 12 months
What is the current Adults Who Paid Less or Skipped Bills reading?
18.3% of U.S. adults in the Q3 2026 wave of the Federal Reserve Bank of Philadelphia's LIFE Survey reported paying less or skipping other debts or monthly bills at least once in the prior 12 months to help afford their bills. A year earlier it was 19.2%, about the same. It is a 12-month look back at one coping strategy, not a missed-payment rate for the quarter. Source: Philadelphia Fed Consumer Finance Institute.
Measurement basis: Share of adult respondents who reported paying less or skipping other debts or monthly bills at least once in the prior 12 months to help afford monthly bill payments. Respondents could select one or more listed coping strategies; this is not a quarterly or monthly missed-payment rate.
In the Philadelphia Fed's Q3 2026 LIFE Survey, 18.3% of adults said they had paid less on or skipped other debts or monthly bills at least once in the prior 12 months.
The Philadelphia Fed's Consumer Finance Institute asks adults each quarter which of eight listed strategies they used in the last 12 months to help afford their monthly bills. In the Q3 2026 wave, 18.3% chose “paying less or skipping other debts or monthly bills.” A year earlier, in the Q3 2025 wave, it was 19.2%, too close to call a change.
One answer covers both paying less and skipping, and it names no bill type, amount or number of bills. So the share is not a count of missed payments, and it does not show that any account went delinquent. The Philadelphia Fed notes that people may have used these strategies only for a while.
The shares are not seasonally adjusted, meaning they are not corrected for patterns that repeat at the same time each year. That is why this page compares each wave with the same wave a year earlier. The Philadelphia Fed tests its changes for statistical significance, and its April 2026 and July 2026 reports found no significant quarter-to-quarter change in any single strategy.
Respondents come from YouGov's opt-in online panel and are weighted to match U.S. adults by age, gender, race and ethnicity, education and region. It is not a random sample, so no margin of error is published. Starting with the January 2026 wave, the weights use 2024 Census benchmarks; earlier waves were not re-weighted.
This survey, the total delinquency rate, the personal saving rate and Bankrate's emergency savings survey use different populations and measure different behavior. Reading them side by side does not show a path from a survey answer to a missed payment or a foreclosure.
Explore Further
Adults Who Paid Less or Skipped Bills over time: what has changed?

Counties with the highest safety net and buffer scores
These are safety net and buffer scores from our County Distress Index, not county readings of Adults Who Paid Less or Skipped Bills.
Explore all 3,144 counties →| Period | Value | YoY Change |
|---|---|---|
| Q3 2026 | 18.3% | -0.9 pp |
| Q2 2026 | 17.4% | -0.9 pp |
| Q1 2026 | 18.5% | +1.8 pp |
| Q4 2025 | 19.7% | +1.9 pp |
| Q3 2025 | 19.2% | +2.3 pp |
| Q2 2025 | 18.3% | +2.5 pp |
| Q1 2025 | 16.7% | -1.5 pp |
| Q4 2024 | 17.8% | -0.2 pp |
| Q3 2024 | 16.9% | +2.2 pp |
| Q2 2024 | 15.8% | +0.6 pp |
| Q1 2024 | 18.2% | +2.3 pp |
| Q4 2023 | 18% | — |
Frequently Asked Questions
What does the skip rate measure?
The share of adults who say they paid less on or skipped other debts or monthly bills at least once in the last 12 months to help afford their monthly bills. It is one option in a list of coping strategies, and people could choose more than one.
Is the skip rate going up or down?
It was 18.3% in the Q3 2026 wave. In Q3 2025 it was 19.2%, too close to call a change. We compare each wave with the same wave a year earlier because the shares are not seasonally adjusted.
Is this a missed-payment or delinquency rate?
No. It asks whether someone used the strategy at least once in 12 months, not how often, which bill, or whether an account fell behind. Delinquency rates come from credit records, not from this survey.
Where does the skip rate data come from?
The Philadelphia Fed's Consumer Finance Institute runs the LIFE Survey four times a year, in waves named for January, April, July and October. YouGov collects the answers online. Recent reports came out the month after each wave.


Quick poll
Is this affecting you or your household?
Discussion
Get the numbers when they move.
New data drops, indicator updates, and American Distress Index changes — delivered when it matters. No spam.
or Create an Account for full access
Loading comments…