Total Revolving Credit Outstanding
Total revolving credit (mostly credit cards) outstanding
What is the current Total Revolving Credit Outstanding reading?
U.S. revolving credit outstanding, mostly credit card balances, was $1.36 trillion in July 2026, according to the Board of Governors of the Federal Reserve System's G.19 Consumer Credit release, up from $1.31 trillion a year earlier. It covers cards and other revolving lines held by banks, credit unions and finance companies, and leaves out home equity lines. Source: Federal Reserve G.19 (July 2026), data retrieved via FRED series REVOLSL.
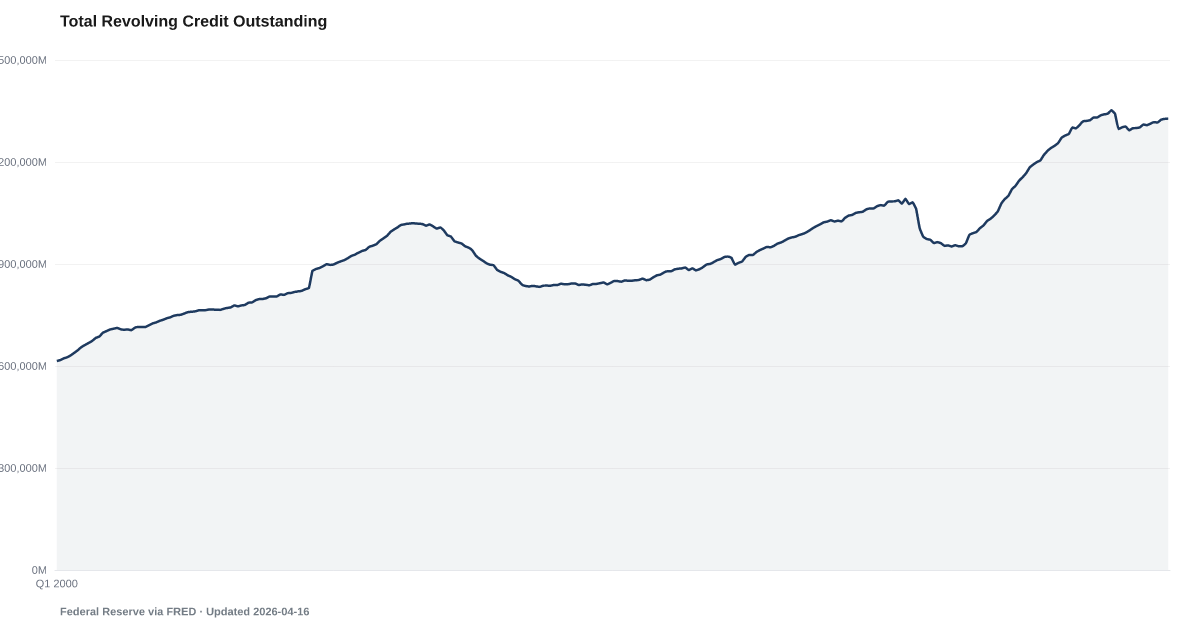
Revolving credit outstanding was $1.36 trillion in July 2026, up $46.94 billion from a year earlier, the most since the series began in 1968, in dollars not adjusted for inflation.
Banks, credit unions and finance companies held $1.36 trillion in revolving consumer credit in July 2026, the Federal Reserve's G.19 release shows, up from $1.31 trillion a year earlier. The seasonally adjusted balance was little changed from June 2026.
No month since the series began in 1968 shows a larger balance. That is a record in current dollars, not adjusted for inflation or population growth. The newest month is preliminary and is usually revised in the next release.
Revolving credit is a line you can borrow against up to a limit and repay over time. Most of it is credit card loans; overdraft lines and other revolving plans are in it too. Home equity lines are not, because the Fed leaves out anything secured by real estate. The balance includes cards paid off in full each month, so not all of it carries interest, and it counts dollars on lenders' books, not how many people owe them.
Changes here are differences between the published monthly balances, seasonally adjusted to remove the usual swings of the calendar. When the Fed reclassifies loans the balance can step with no change in borrowing: in December 2024 new bank reporting rules took securities-backed loans out. The Fed states its growth rates at an annual rate, so a month's rate in the release is not the change shown here.
The New York Fed and credit bureaus publish their own credit card balance totals from credit reports, and they differ from this lender-reported figure. Card interest rates are tracked on the credit card interest rate page, and the share of household debt balances that are behind on payments in the total delinquency rate. Neither shows why balances changed.
Explore Further
Total Revolving Credit Outstanding over time: what has changed?

Counties with the highest safety net and buffer scores
These are safety net and buffer scores from our County Distress Index, not county readings of Total Revolving Credit Outstanding.
Explore all 3,144 counties →| Period | Value | YoY Change |
|---|---|---|
| Jul 2026 | $1.36T | +$0.05T |
| Jun 2026 | $1.35T | +$0.05T |
| May 2026 | $1.35T | +$0.05T |
| Apr 2026 | $1.35T | +$0.05T |
| Mar 2026 | $1.34T | +$0.05T |
| Feb 2026 | $1.33T | +$0.03T |
| Jan 2026 | $1.33T | +$0.03T |
| Dec 2025 | $1.32T | +$0.02T |
| Nov 2025 | $1.32T | -$0.02T |
| Oct 2025 | $1.32T | -$0.03T |
| Sep 2025 | $1.31T | -$0.03T |
| Aug 2025 | $1.31T | -$0.03T |
Frequently Asked Questions
How much revolving credit do Americans have outstanding?
Lenders held $1.36 trillion in revolving consumer credit in July 2026, up from $1.31 trillion a year earlier. Most of it is credit card loans. It is a total on lenders' books, so it is not debt per person.
Is revolving credit at a record high?
Yes, in current dollars: the latest balance is the highest of 703 monthly readings since 1968, not adjusted for inflation. A dollar record says little on its own, because prices and incomes grow over time, and earlier balances included loans the Fed has since reclassified out.
Does revolving credit include home equity lines?
No. The Fed's consumer credit release leaves out loans secured by real estate, so home equity lines of credit are not in it. The New York Fed reports home equity lines separately.
Where does the data come from?
The Federal Reserve Board's G.19 Consumer Credit release. The Fed estimates it from bank and credit union call reports and panels of banks and finance companies. It comes out around the fifth business day of each month and covers the month two months earlier.


Quick poll
Is this affecting you or your household?
Discussion
Get the numbers when they move.
New data drops, indicator updates, and American Distress Index changes — delivered when it matters. No spam.
or Create an Account for full access
Loading comments…