SNAP (Food Stamp) Enrollment
People in households receiving SNAP benefits, reported monthly to USDA
What is the current SNAP (Food Stamp) Enrollment reading?
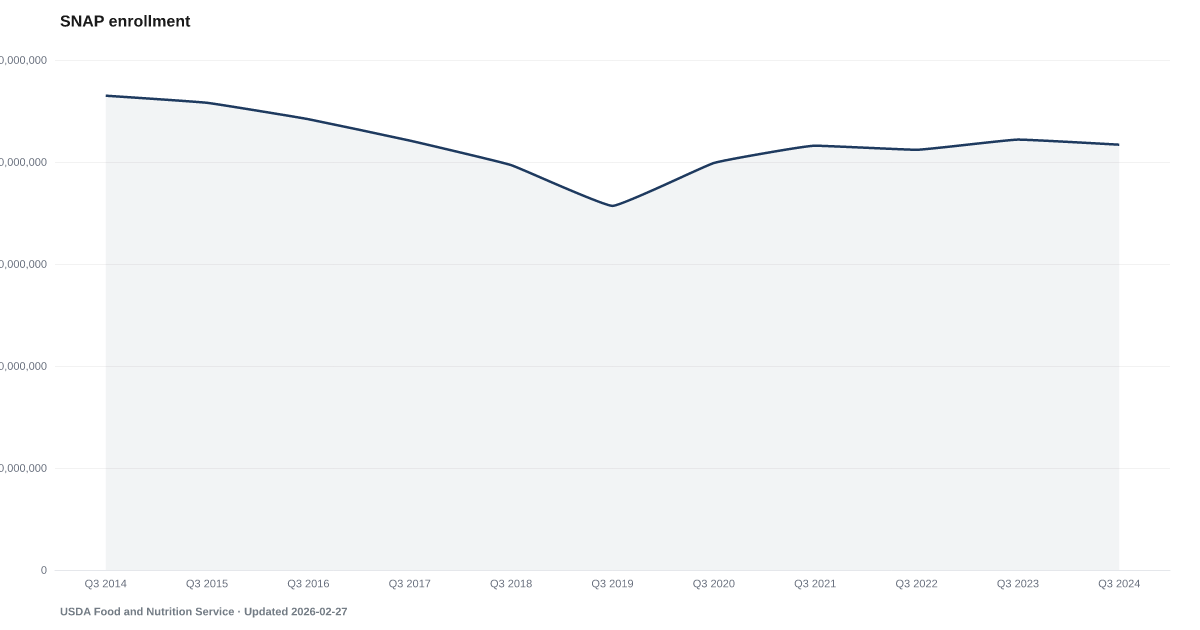
In June 2026, 36.35 million people were in households receiving SNAP benefits, according to preliminary U.S. Department of Agriculture figures, down from 41.67 million a year earlier. SNAP, the Supplemental Nutrition Assistance Program, was formerly called food stamps. The count covers people in households that states certified and issued benefits in the month; it is a program count, not a count of people who are hungry. Source: USDA Food and Nutrition Service program data.
SNAP served 36.35 million people in June 2026, down from 41.67 million a year earlier, preliminary USDA data show.
State SNAP agencies reported 36.35 million people in participating households for June 2026. A year earlier, in June 2025, the count was 41.67 million, so it is down 5.32 million. The count was 36.69 million in May 2026; the one-month change is smaller than routine revisions and seasonal swings. In USDA's current tables, it is the lowest monthly count in our monthly series, which starts in 2022. USDA labels the two latest months preliminary and subject to significant revision.
In USDA's current tables, the count has been below its year-earlier level for 13 months in a row.
A person counts if their household was certified and issued SNAP benefits that month, whether or not the benefits were used, or was found eligible for a zero benefit. The count covers the 50 states, Washington, D.C., Guam and the U.S. Virgin Islands. Puerto Rico, American Samoa and the Northern Mariana Islands run separate nutrition grants and are not included, and neither are Pandemic EBT or Summer EBT benefits for children. USDA publishes a separate, smaller count of households.
USDA's tables come out about two and a half months after the month they cover, and later tables revise earlier months, sometimes by hundreds of thousands of people. USDA reports the counts without stating a cause for any change. Before October 2022 this series holds fiscal-year averages rather than single months, so the chart's earlier points are not comparable with the monthly ones.
SNAP enrollment, the personal saving rate, and emergency-savings surveys use different populations and methods. Read them as separate context; none of them shows why a household takes part in SNAP.
Explore Further
SNAP (Food Stamp) Enrollment over time: what has changed?

Counties with the highest debt burden scores
These are debt burden scores from our County Distress Index, not county readings of SNAP (Food Stamp) Enrollment.
Explore all 3,144 counties →| Period | Value | YoY Change |
|---|---|---|
| Jun 2026 | 36.35M | -5.32M |
| May 2026 | 36.69M | -5.15M |
| Apr 2026 | 37.11M | -4.84M |
| Mar 2026 | 37.53M | -4.66M |
| Feb 2026 | 37.95M | -4.23M |
| Jan 2026 | 38.55M | -3.86M |
| Dec 2025 | 39.21M | -3.75M |
| Nov 2025 | 40M | -3.01M |
| Oct 2025 | 40.67M | -2.58M |
| Sep 2025 | 41.21M | -1.11M |
| Aug 2025 | 41.42M | -0.85M |
| Jul 2025 | 41.6M | -0.43M |
How to read this series
The source changed how it measures this in Oct 2022. Readings through September 2022 are annual fiscal-year figures dated to the September 30 fiscal-year end. From October 2022 the series carries USDA's individual monthly participation counts, so a reading before this date summarises a whole year and a reading after it counts one month. Readings on either side are not directly comparable, so the year-over-year column stays blank where a comparison would cross that date. Source documentation.
Frequently Asked Questions
How many people receive SNAP benefits?
The latest USDA tables show 36.35 million people in households receiving SNAP benefits in June 2026, a preliminary figure. USDA also publishes a fiscal-year average, which is a different number from any single month.
Is this the number of households, or of people who cannot afford food?
Neither. It counts people, and a household can include several people; USDA reports households separately. It counts participation in the program, not hunger or food insecurity, which other surveys measure.
Where does SNAP participation data come from?
State SNAP agencies report monthly totals to the U.S. Department of Agriculture, which publishes them in its SNAP data tables with no fixed release calendar. The two latest months are preliminary, and later tables revise earlier months. County-level figures are published only for January and July, and not for every state.


Quick poll
Is this affecting you or your household?
Discussion
Get the numbers when they move.
New data drops, indicator updates, and American Distress Index changes — delivered when it matters. No spam.
or Create an Account for full access
Loading comments…