JOLTS Quits Rate
Quits as a share of nonfarm payroll employment
What is the current JOLTS Quits Rate reading?
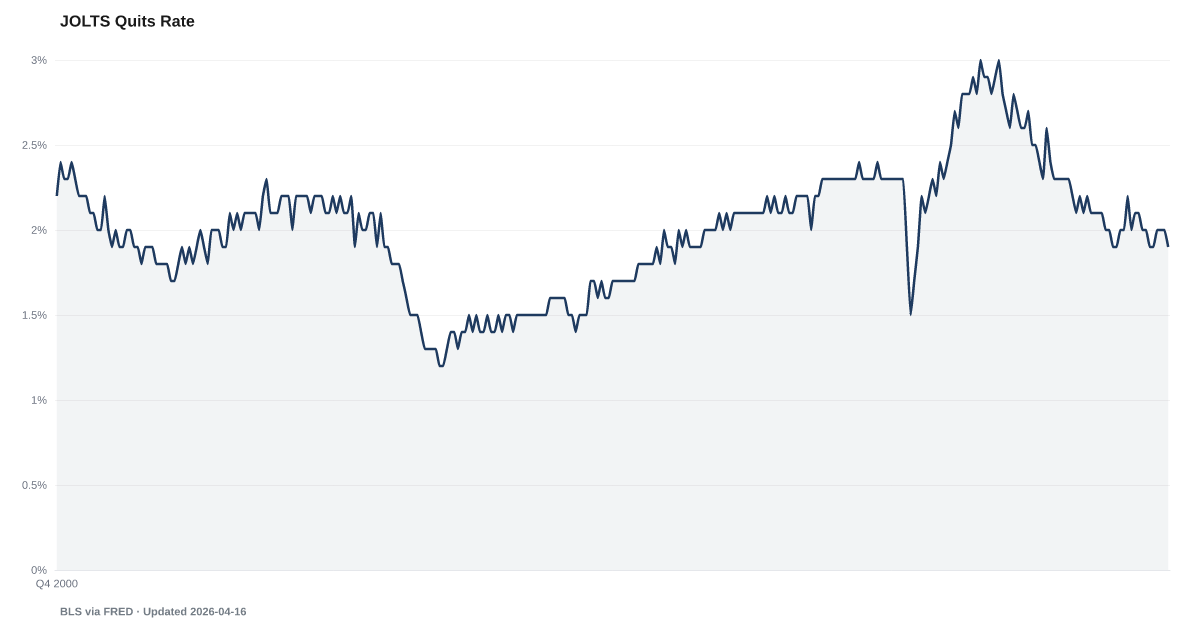
The JOLTS quits rate was 1.9% in August 2026, the same as in July 2026, according to the U.S. Bureau of Labor Statistics. It is the number of workers who quit during the month, not counting retirements, as a share of nonfarm payroll employment, seasonally adjusted. Source: BLS Job Openings and Labor Turnover Survey data retrieved via FRED (JTSQUR).
Quits equaled 1.9% of U.S. payroll jobs in August 2026.
The Bureau of Labor Statistics' first estimate puts the quits rate at 1.9%, the same as in July 2026. A year earlier it was 2%, about the same.
Quits are workers who left a job voluntarily during the month, other than retirements and transfers, which BLS counts separately. The rate divides quits by payroll employment, not by the labor force, and covers private nonfarm businesses and civilian government. The survey asks employers how many people quit, not why, so it does not say whether they left for a better job. BLS says the rate can serve as a measure of workers' willingness or ability to leave jobs.
JOLTS is a monthly survey of about 21,000 business and government worksites. Each month's first estimate is revised the next month, and each March BLS revises the past five years. BLS calls a move a rise or fall only when it passes a significance test, so a 0.1-point move is called little changed here, as BLS called July 2026's. Estimates for September and October 2025, collected during and after the federal shutdown, are not used as comparison points.
The Indeed Job Postings Index, Continued Unemployment Claims and the Atlanta Fed Wage Growth Tracker each measure a different part of the job market. The Unemployment Rate comes from a separate household survey.
Explore Further
JOLTS Quits Rate over time: what has changed?

Counties with the highest labor scores
These are labor scores from our County Distress Index, not county readings of JOLTS Quits Rate.
Explore all 3,144 counties →| Period | Value | YoY Change |
|---|---|---|
| Aug 2026 | 1.9% | -0.1 pp |
| Jul 2026 | 1.9% | -0.1 pp |
| Jun 2026 | 2% | -0.1 pp |
| May 2026 | 2% | -0.1 pp |
| Apr 2026 | 1.9% | -0.1 pp |
| Mar 2026 | 2% | -0.2 pp |
| Feb 2026 | 1.9% | -0.1 pp |
| Jan 2026 | 2% | 0 pp |
| Dec 2025 | 2% | +0.1 pp |
| Nov 2025 | 2% | +0.1 pp |
| Oct 2025 | 1.9% | — |
| Sep 2025 | 1.9% | — |
Frequently Asked Questions
What is the JOLTS quits rate?
It is the number of voluntary quits employers report in a month, divided by their payroll employment. In August 2026 it was 1.9%, little changed from 2% a year earlier. Retirements and transfers are counted separately and are not quits.
Does a low quits rate mean workers feel stuck?
The survey cannot say. Employers report how many people quit, not why. BLS describes the rate as a measure of workers' willingness or ability to leave jobs and gives no reason for any month's move.
Is this the share of all American workers who quit?
No. The denominator is nonfarm payroll employment, not the labor force. Farm workers, household workers and the self-employed are outside the survey.
Where does this data come from?
The Bureau of Labor Statistics publishes it monthly in the Job Openings and Labor Turnover Survey (JOLTS), about a month after the month it covers. FRED carries the seasonally adjusted total nonfarm rate as JTSQUR, starting in December 2000.


Quick poll
Is this affecting you or your household?
Discussion
Get the numbers when they move.
New data drops, indicator updates, and American Distress Index changes — delivered when it matters. No spam.
or Create an Account for full access
Loading comments…